Figure 6.

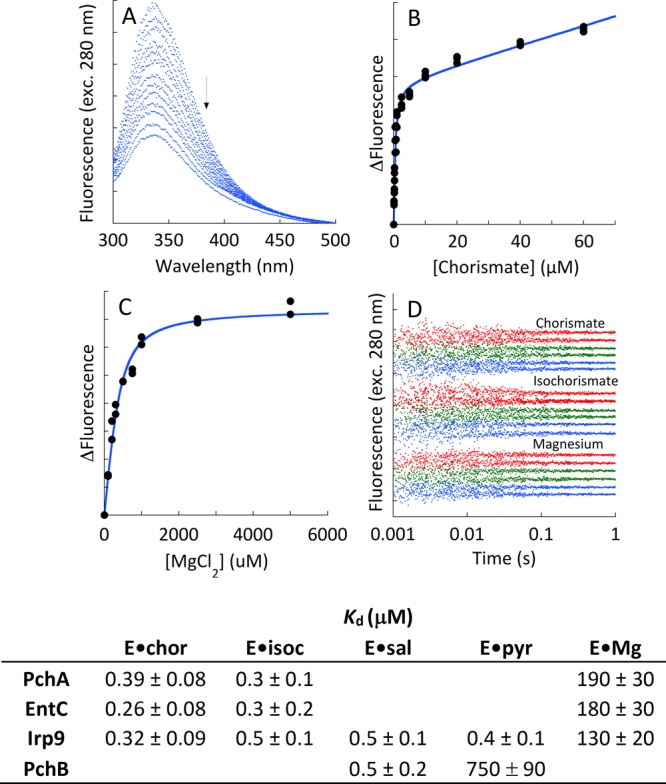
Dissociation constants of ligands from MST enzymes. (A) The titration depicts the perturbation of intrinsic tryptophan fluorescence that is observed when chorismate is titrated to Irp9. The arrow denotes increasing chorismate concentration. (B) The fit of the change in fluorescence to a single binding isotherm plus a linear term that accounts for chorismate inner filter, as described by eq 3. (C) Titration of Irp9 with magnesium showing the fit of the change in fluorescence to a single binding isotherm. (D) Kinetics of ligand binding. EntC (green, 0.75 μM), PchA (red, 0.75 μM), and Irp9 (blue, 0.1 μM) when mixed with chorismate (0.5 μM upper trace, 5 μM lower trace), isochorismate (0.5 μM upper trace, 5 μM lower trace), and magnesium (0.310 mM upper trace, 1.25 mM lower trace). For each ligand set, pairs of traces have been separated for clarity. The table includes dissociation constants of all of the native ligands from each of the enzymes studied as measured by comparable methods.
