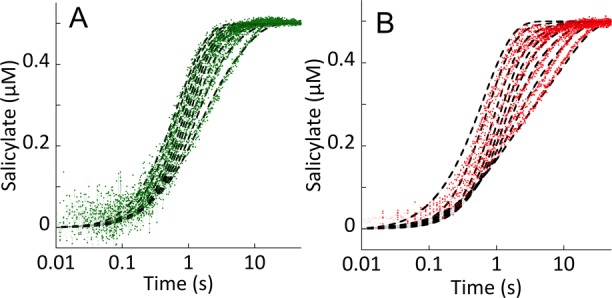
Figure 8.

Suppression of the rate of isochorismate release with exogenous magnesium. (A) EntC (5 μM final concentration in the presence of 100 μM EDTA final concentration) was mixed with 2 μM isochorismate (0.5 μM final concentration), and the mixture was allowed to age for 0.5 s before subsequent mixing with 0–20 mM magnesium (increasing Mg concentration left to right) and PchB (5 μM final concentration). (B) PchA (5 μM final concentration in the presence of 100 μM EDTA final concentration) was mixed with 2 μM isochorismate (0.5 μM final concentration), and the mixture was allowed to age for 0.5 s before subsequent mixing with 0–20 mM magnesium (increasing Mg concentration left to right) and PchB (5 μM final concentration). For both enzymes, isochorismate release was visualized by the increase in fluorescence due to the activity of PchB. The data were modeled and fit using the numerical integration routine available within KinTek Explorer (dashed black lines). The model included all of the relevant kinetic steps, including those for PchB and EDTA. All known equilibrium constants and rate constants were fixed, and only the steps required to form or dissociate the E·isochorismate·Mg complex were optimized to obtain the fits.
