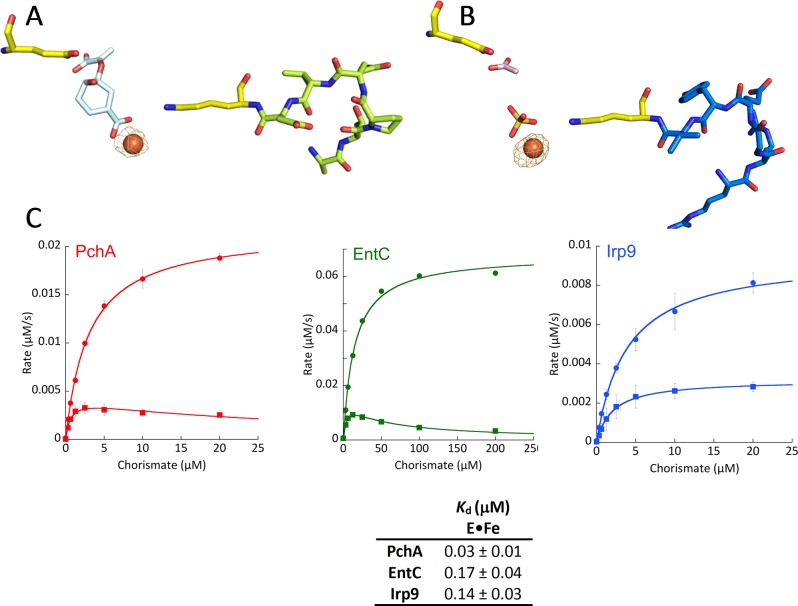
Figure 9.
Binding of iron to EntC and Irp9. Experimental anomalous difference maps contoured at 5σ (orange cages) show that ferrous ions bind at the catalytic magnesium site. (A) Fe-EntC. Chorismate is shown in pale-cyan sticks. The general base (K147) and general acid (E197) are shown in yellow. The loop preceding the general base (141-ATPQVD-146) is shown in lime-green sticks. It should be noted that there is no iron anomalous signal at this loop. (B) Fe-Irp9. A sulfate (gold sticks) is bound to the iron in monomer A, whereas an acetate (pink sticks) has been modeled at the pyruvate binding site. The general base (K193) and general acid (E240) are shown in yellow. The loop preceding the general base (187-RRGEYV-192) is shown in marine-blue sticks. (C) Inhibition by iron in the steady state. The upper Michaelis–Menten curve (circles) was obtained in the absence of iron, whereas the lower curve (squares) was obtained in the presence of 125 μM ferrous ammonium sulfate. The table shows dissociation constants for Fe(II) binding, measured by the change in intrinsic tryptophan fluorescence fit to a single binding isotherm plus a linear term.

