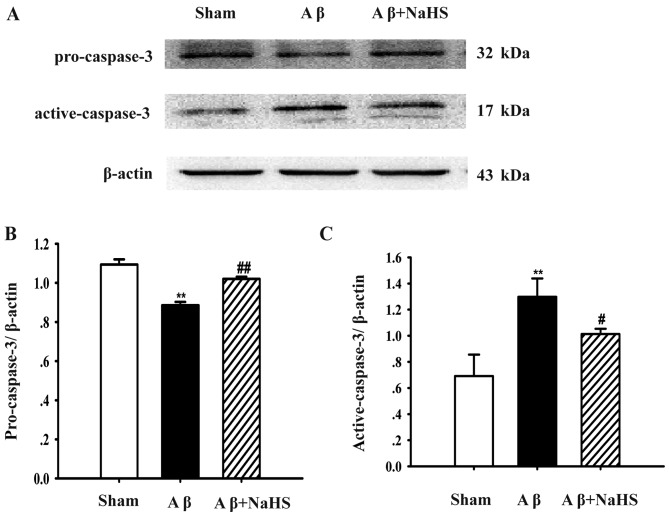
Figure 3.
Effects of sodium hydrosulfide (NaHS) on the protein levels of pro-caspase-3 and cleaved-caspase-3 in the hippocampus after the injection of Aβ25–35 for 15 days. (A) Protein contents were analyzed by western blot analysis for the sham-operated, Aβ25–35 and Aβ25–35 + NaHS groups, respectively. (B) Quantification of pro-caspase-3 protein. (C) Quantification of active-caspase-3 protein. The relative optical density was normalized to β-actin. Data are presented as the means ± SEM (n=3 rats in each group, for triplicate experiments). **P<0.01 vs. sham-operated (sham) group; #P<0.01 or ##P<0.05 vs. Aβ25–35 group.

