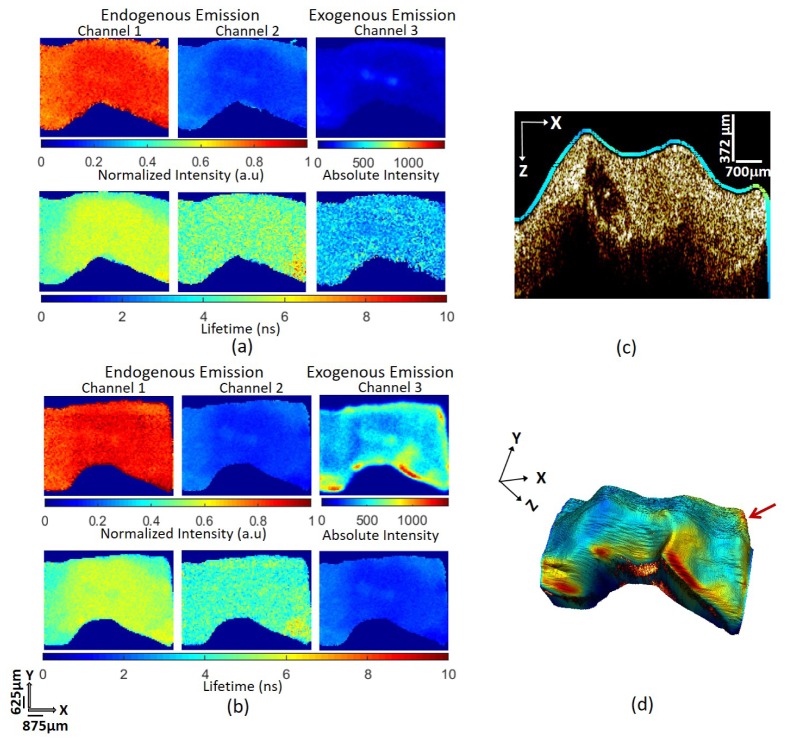
Fig. 5.
Results obtained by imaging human coronary artery before and after tagging with Alexa Fluor 532. (a) FLIM maps of the artery before tagging. (b) FLIM maps of the tissue after tagging. Intensity in channel 1 in both figures is higher than that in channel 2, suggesting a strong contribution of collagen fluorescence in the signal. Comparison of the absolute emission intensities in channel 3 of these figures indicate successful tagging of Alexa Fluor 532. Average lifetime of the tissue in channel 3 before tagging is 3.07 ± 0.26 ns. Channel 3 average lifetime after tagging (1.91 ± 0.03 ns) is similar to the lifetime of nonspecific tagged Alexa Fluor 532 in the Watanbe rabbit sample. (c) Representative cross-sectional image from the OCT volume overlaid with the exogenous emission map. The OCT image is consistent with pathological intimal thickening. The dark region (center-left) is a calcified area. The fluorescence intensity is consistent with a relatively uniform expression of LOX-1 except on the right corner of the tissue. (d) OCT volume image overlaid with the exogenous FLIM emission map. Red arrow indicates the approximate location of the cross-sectional image shown in (c).

