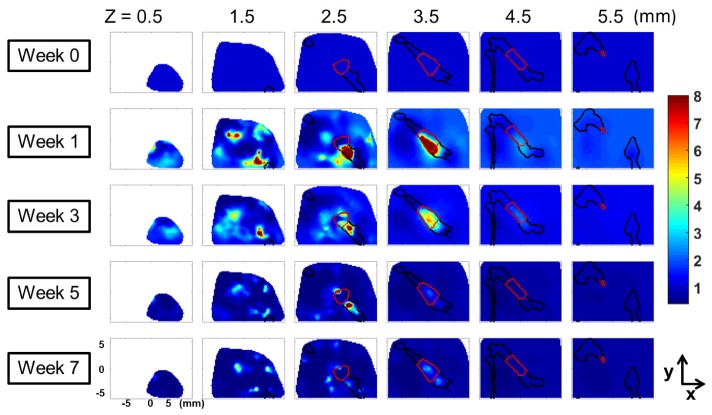
Fig. 7.
Longitudinal rBF changes in an autograft mouse at selected weeks and tissue depths. rBF is obtained by normalizing the reconstruction results from each week to the results of week 0. The rows show the results at weeks 0, 1, 3, 5 and 7, respectively and the columns show the results at tissue depths z = 0.5 mm, 1.5 mm, 2.5 mm, 3.5 mm 4.5 mm and 5.5 mm, respectively. (Black lines: outline of the bones; red lines: outline of the graft)

