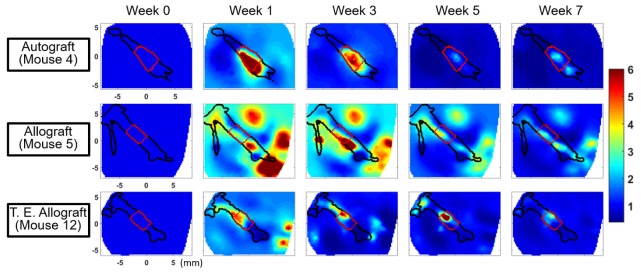
Fig. 8.
Comparison of blood flow changes in different graft types with varying degree of healing potential. One representative mouse from each group is selected and only the z slice which includes the center of the femur is shown: autograft (z = 3.5 mm), allograft (3.2 mm) and T. E. allograft (3.2 mm). The columns show the results at weeks 0, 1, 3, 5 and 7, respectively. (Black lines: outline of the bones; red lines: outline of the grafts)

