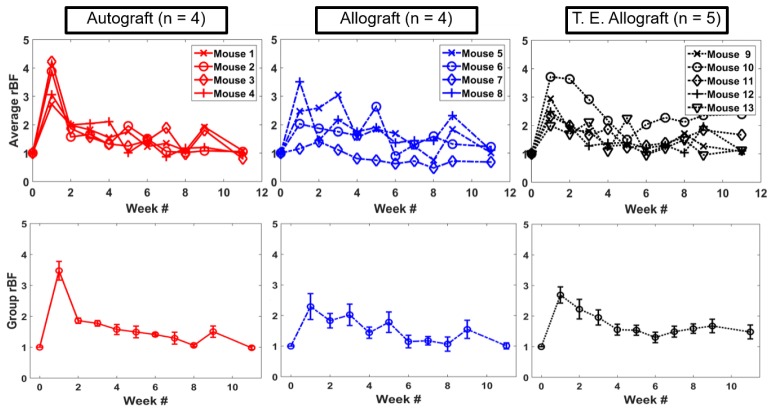
Fig. 9.
Average relative blood flow changes in the graft region for mice in the three different groups. Each curve shows the longitudinal changes of one mouse and each plot includes the mice from the same group. Top row shows longitudinal changes of individual mice and bottom row shows group averaged longitudinal changes of each group. The error bar is the standard error of the mean for the group averaged rBF.

