Fig. 10.

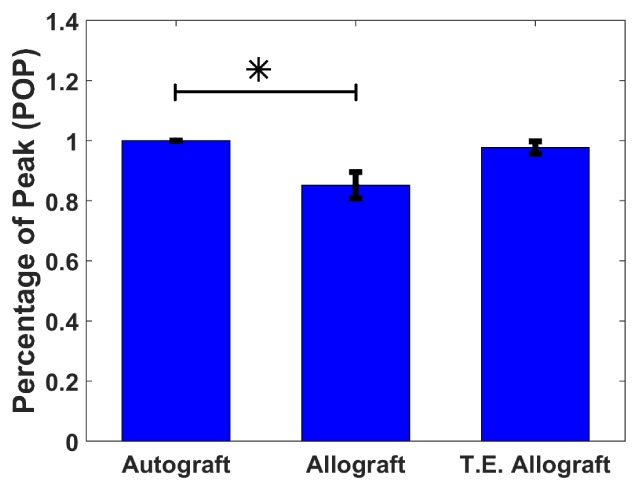
Group-averaged Percentage of Peak (POP) at week 1 for the three graft groups. The error bar is the standard error of the mean. The asterisk (*) indicates that the allograft group is significantly different from the autograft group.

Group-averaged Percentage of Peak (POP) at week 1 for the three graft groups. The error bar is the standard error of the mean. The asterisk (*) indicates that the allograft group is significantly different from the autograft group.