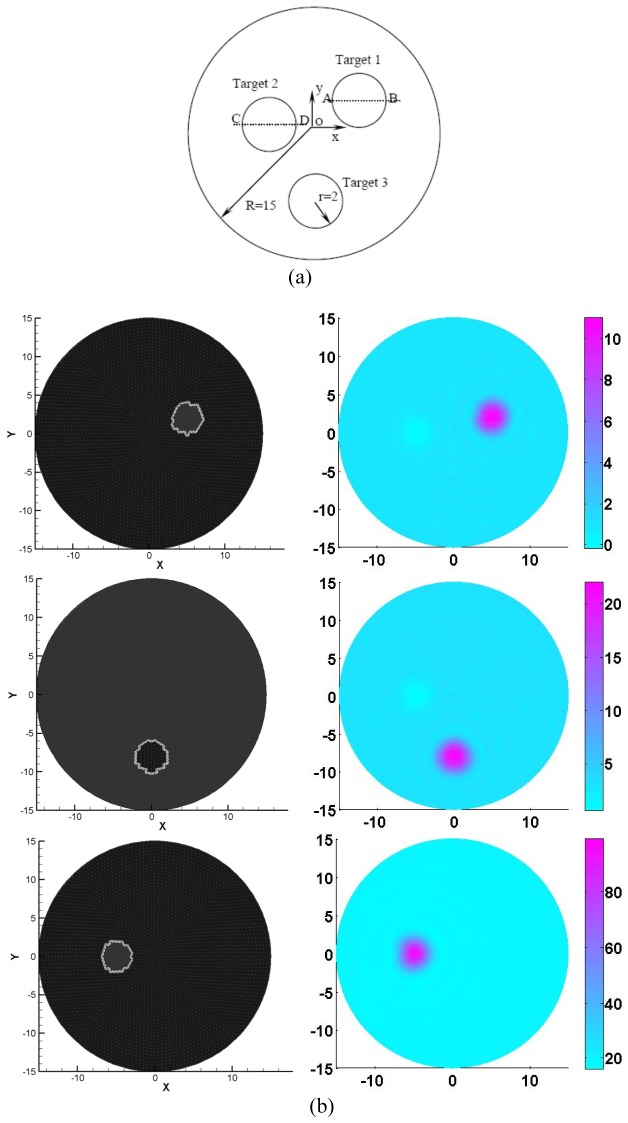
Fig. 2.
(a) Test geometry. The dimension units are in millimeters. (b) The exact (left column) and recovered (right column) images using 6 optical wavelengths. The first to the third rows of Fig. 2(b) denote the Hb, HBO2 and H2O, respectively. The axes (left and bottom) illustrate the spatial scale, in mm, whereas the color scale (right) denote HbO2 and HbR in μM, and H2O in percentage.

