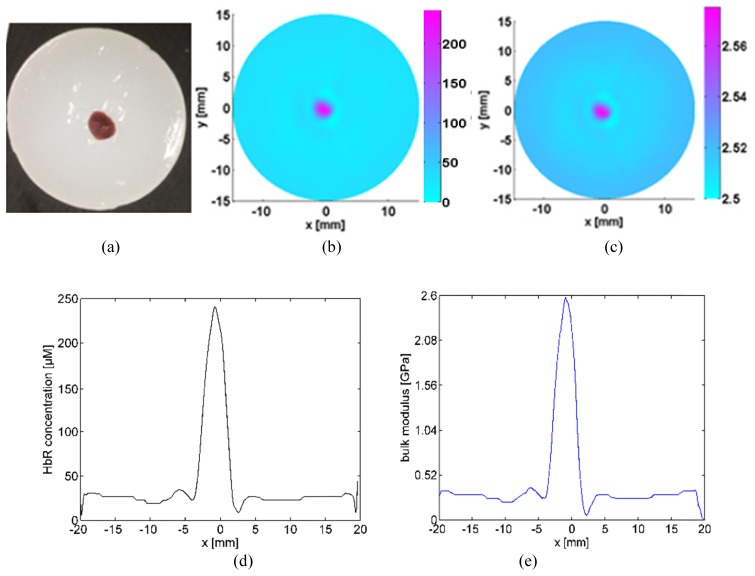
Fig. 6.
The Photograph of the porcine liver tissue used for the second in vitro experimental test (a), the recovered HbR concentrations image (b), the recovered K (c), the HbR profile plotted along the center of the target (d), and the K profile plotted along the center of the target (e). The axes (left and bottom) illustrate the spatial scale, in mm, whereas the color scale (right) denote HbR in μM and K in GPa.

