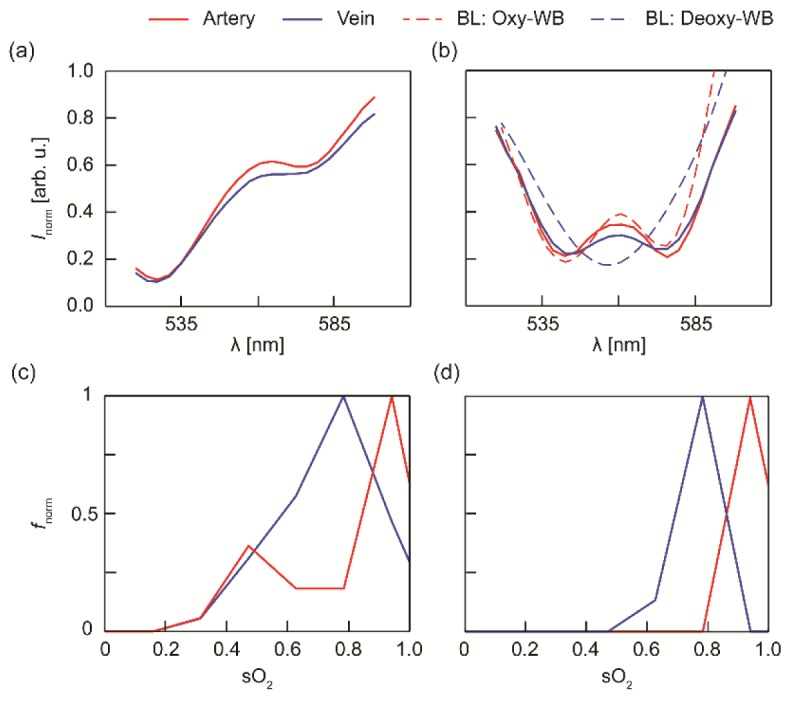
Fig. 2.

OCT angiography spectra from selected artery and vein before and after scattering correction. (a) Uncorrected raw OCT intensity spectra. (b) Scattering-corrected OCT intensity spectra. Dashed lines are theoretical intensity spectra for fully oxygenated whole blood (Oxy-WB) and fully deoxygenated whole blood (Deoxy-WB), which are calculated using Beer-Lambert law and compiled literature data for the optical properties of whole blood. (c) Normalized frequency (fnorm) of calculated sO2 using our original method. (d) fnorm of calculated sO2 using the new dual-depth sampling and normalization method.
