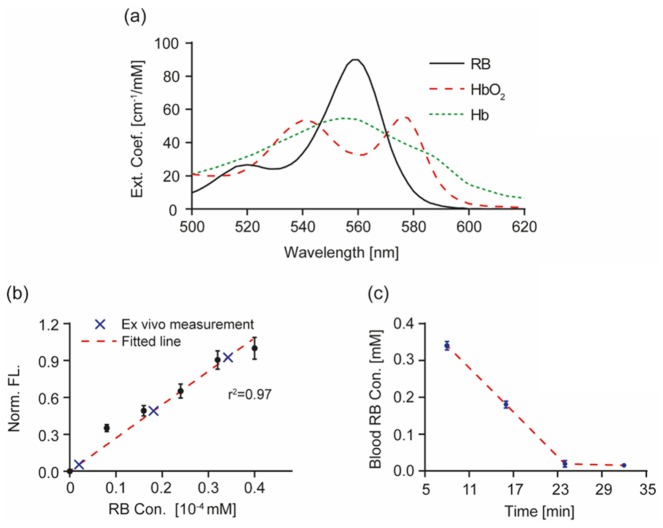
Fig. 5.
Measurement of mouse blood Rose Bengal (RB) concentration using quantitative fluorescence (FL) analysis. (a) Extinction spectra of RB, oxy-hemoglobin (HbO2) and deoxy-hemoglobin (Hb). These three chromophores have overlapping strong absorption within the wavelength range from 500 nm – 620 nm. (b) Calibration curve for quantitative FL measurement of RB concentration. Normalized FL intensity from RB solution is plotted against its known concentrations (black dots, error bar: S.D.). FL intensity showed strong positive correlation with RB concentration. We performed linear regression to retrieve the calibration curve (red dashed line, r2 = 0.97). (c) Blood RB concentration as estimated using quantitative FL measurements at time points 8, 16, 24, and 32 minutes after intravenous RB injection. Blood samples were diluted 10,000 times prior to FL measurement to prevent fluorescence quenching and virtually eliminated blood optical absorption. The first three measurement points are plotted onto the calibration curve in (b) (blue crosses), then converted to blood RB concentration and plotted against time in (c).

