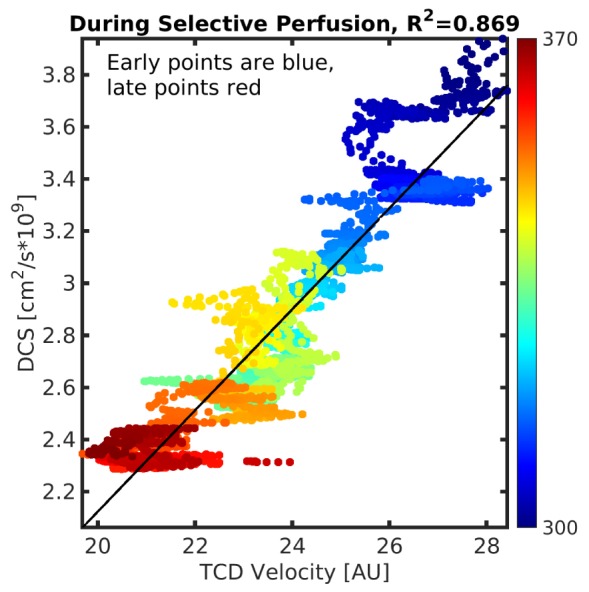
Fig. 4.

DCS blood flow vs. TCD during selective perfusion. The color scale indicates time of measurement during the surgical procedure (i.e., ranging from blue (~300 min.) to red (~370 min). The rapid changes in TCD velocity (i.e., the clusters of time points that make horizontal lines in the plot) likely result from subtle orientation shifts of the TCD probe.
