Fig. 6.
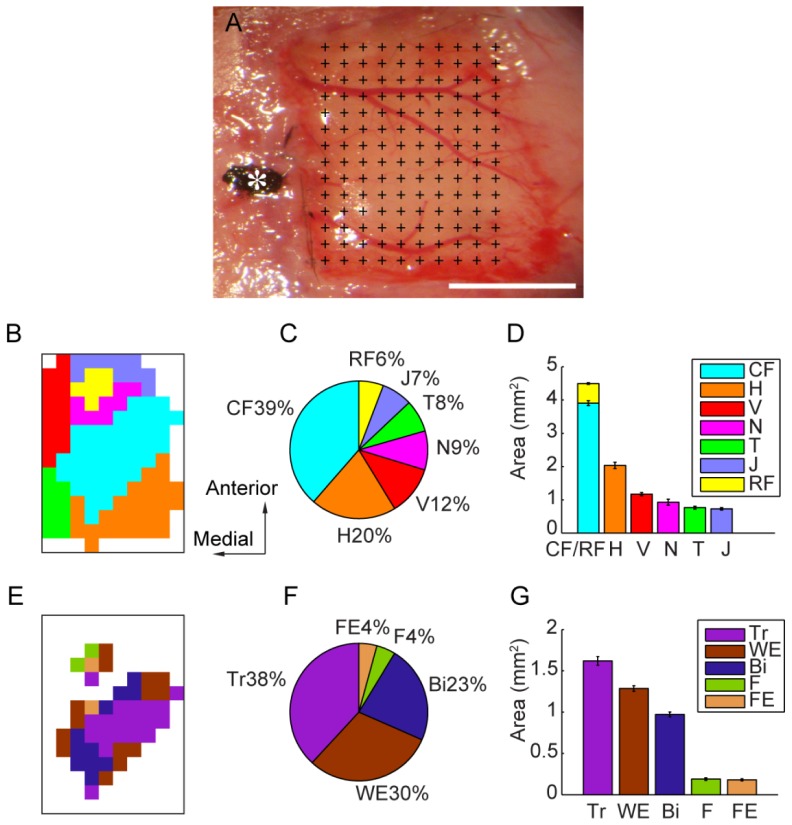
In vivo optogenetic mapping of the primary motor cortex and precise cortical representations of different forelimb muscles. (A): A picture showing the exposed motor cortex from 2.5 mm ahead of the bregma to 1.4 mm behind the bregma and from 0.5 mm to 3.5 mm lateral to the midline. The motor cortex undergoing photostimulation was divided into 14 × 10 arrays of pixels (0.3 mm spacing), covering a total of 13 mm2. The cross indicates each position of laser photostimulation, and the star indicates the bregma. Scale bar: 2 mm. (B): Primary motor cortex map constructed using optogenetic methods, with different colors indicating different parts. (C): Percentage of different types of body movements represented in the primary motor cortex. The caudal forelimb (CF) is shown in blue, the rostral forelimb (RF) is shown in yellow, the jaw (J) is shown in dark blue, the trunk (T) in shown in green, the neck (N) is shown in purple, the vibrissa (V) are shown in red, and the hindlimb (H) is shown in orange. (D): Accumulated areas representing different types of body movements with standard errors. (E): Primary motor cortex map constructed using optogenetic methods, with different colors indicating the different forelimb muscles. (F): Percentage of different types of forelimb movements represented in the primary motor cortex. The triceps muscle (Tr) is shown in purple, the wrist extension muscle (WE) in shown in gray, the biceps muscle (Bi) is shown in dark blue, the forearm flexor muscles (F) are shown in green, and the finger extension muscles (FE) are shown in orange. (G): Accumulated areas representing the different types of forelimb muscles with standard error.

