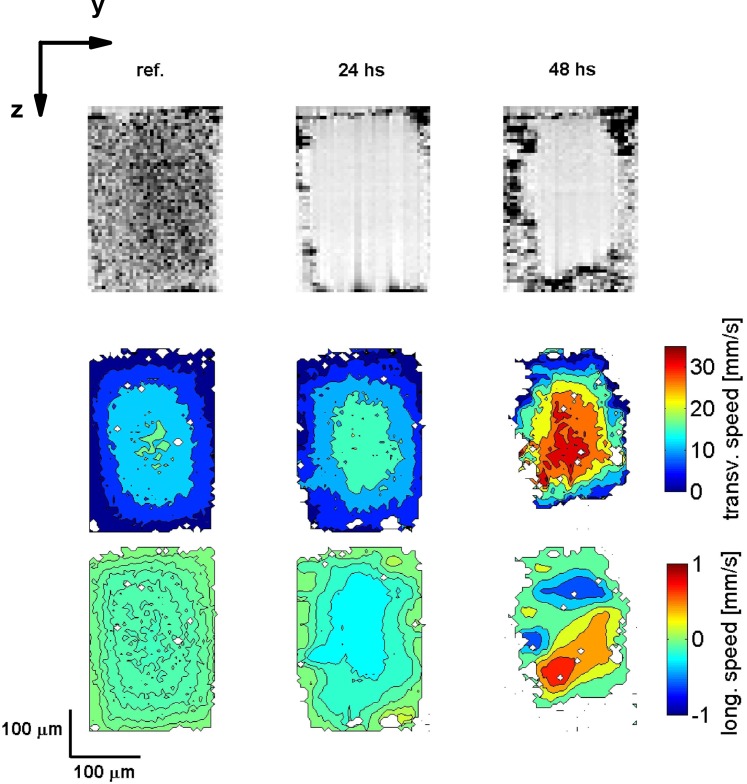
Fig. 5.
Channel morphology and longitudinal and transverse flow velocities in the (y, z)-plane. The first row shows the channel morphology, the second row shows the transverse flow velocity and the third row shows the longitudinal flow velocity. The first column shows the reference data, and the second and third column show the data after 24 and 48 hours after starting the experiment, respectively. The scale of the flow velocity is the same for all three cases. The points where the velocity estimation algorithm did not converge are shown in white.

