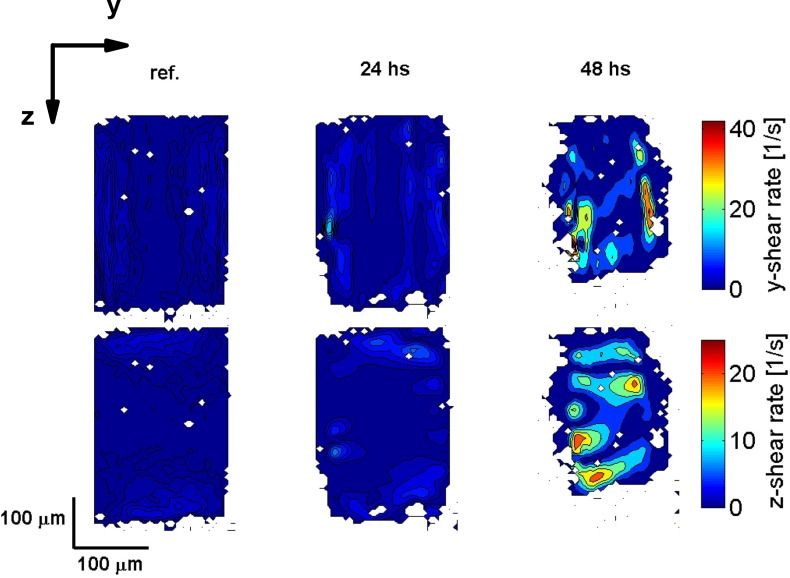
Fig. 8.
Calculated shear-rate in the (y, z)–plane for the longitudinal flow velocity component corresponding to the velocity data shown in Fig. 5. The first row shows the shear-rate in the y-direction and the second row shows the shear-rate in the z-direction. The first column shows the reference data, and the second and third column show the data after 24 and 48 hours after starting the experiment, respectively.

