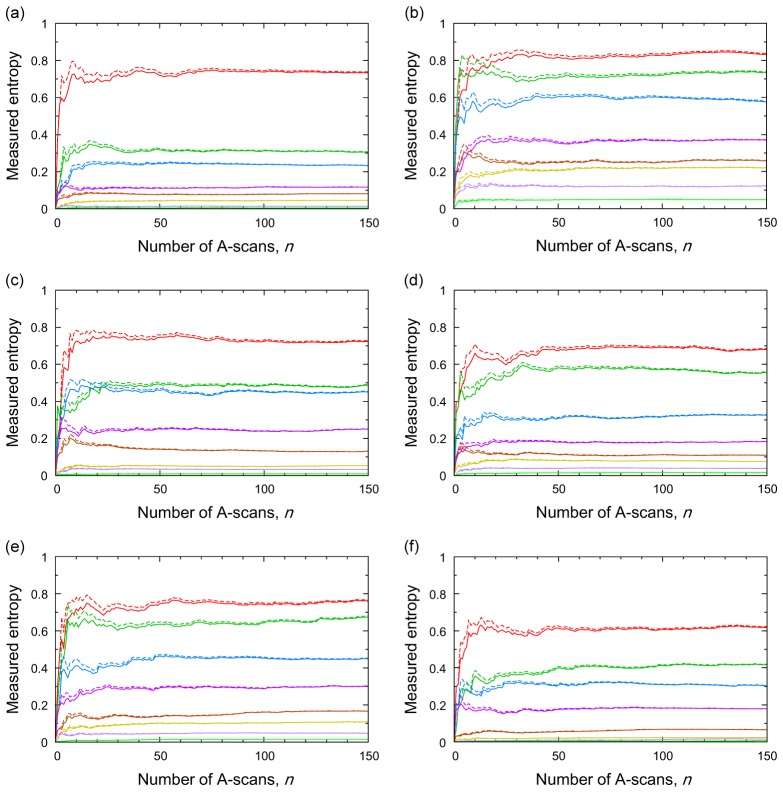
Fig. 3.
Measured entropy without (solid line) or with (dashed line) AQ-MLE. The horizontal axis indicates the number of A-scans n used for the ensemble average of (T). The raw OCT data were measured at different signal intensities, and the results were plotted with different colors. The samples and the measurement settings are shown in Table 1.

