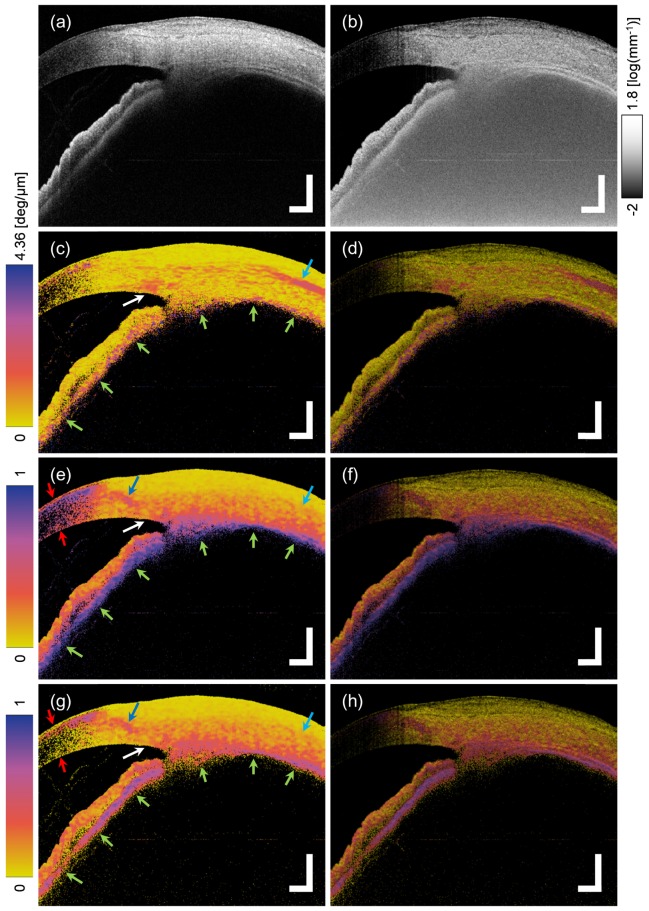
Fig. 6.
Images of the anterior eye segment around the angle at the superior region. Polarization-diverse signal intensity (a), the attenuation coefficient (b), the local retardation R1 (c), the entropy without the correction methods (e), the entropy with AQ-MLE and the bias correction of Hnoise (g). Figures (d), (f) and (h) are the composite images of (c), (e) and (g) with (b), respectively. The scale bars indicate 1 mm in air. Ametrine color map [66] was used for (c)-(h).

