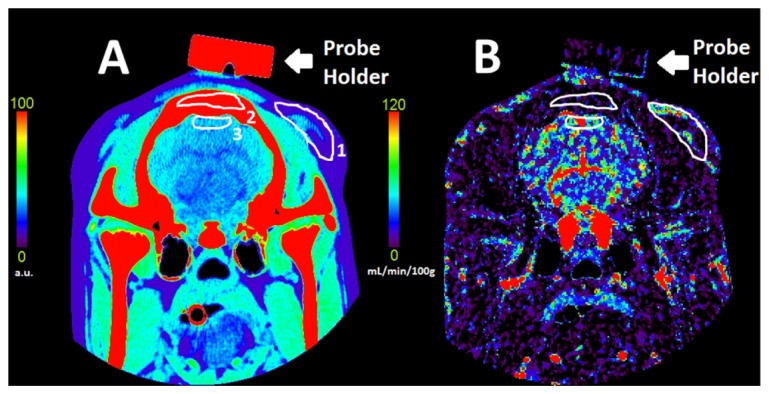
Fig. 3.

Coronal CT image of a pig’s head (A) and the corresponding blood flow map (B). The scalp (1), skull (2) and brain (3) ROIs are shown in white. Bar codes are given to illustrate relative x-ray attenuation (A) and blood flow in mL/min/100g (B).
