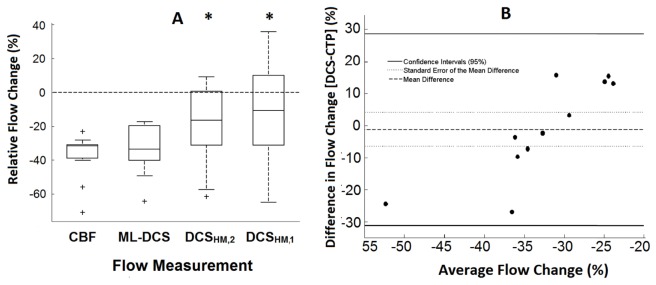
Fig. 7.
(A) Box plot of relative flow change caused by reducing paCO2 from normocapnia to hypocapnia. Flow values of CBF, FB, FHM,1 and FHM,2 measured by CTP (N = 14), ML DCS (N = 11), DCSHM,1 (N = 14) and DCSHM,2 (N = 14), respectively. The center line, box edges, error bars, and the cross represent the median, 1st and 3rd quartiles, CI95%, and outliers, respectively. Significant changes compared to CBF are represented by *. (B) Bland-Altman plot comparing reductions in CBF and FB measured by CTP and ML DCS (N = 11). The mean difference between the two modalities, the standard error of the mean, and the CI95% are indicated by the solid line, the dotted line and the dashed line, respectively.

