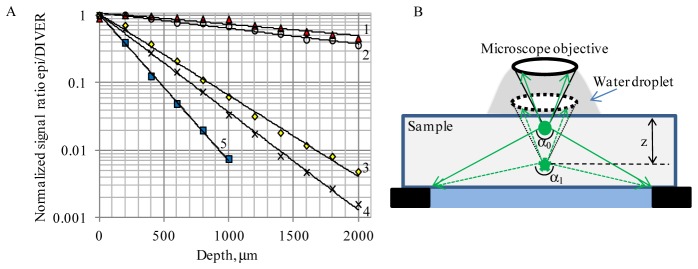
Fig. 3.
A- Plot of normalized signal ratio epi/DIVER detectors vs. imaging depth in 3mm thick samples: 1- clear sample (no ink and TiO2 added); 2- sample with ink added (μa = 0.1mm−1, no TiO2); 3- sample with lower scattering (μs = 3.5mm−1, no ink); 4- sample with lower scattering and ink (μs = 3.5mm−1; μa = 0.1mm−1); 5- sample with higher scattering (μs = 10mm−1, no ink). λexc 800nm. B- Explanation for better DIVER performance at increased imaging depth in clear samples: the effective NA for the DIVER detector increases with depth, while remains the same for the epi-detector.

