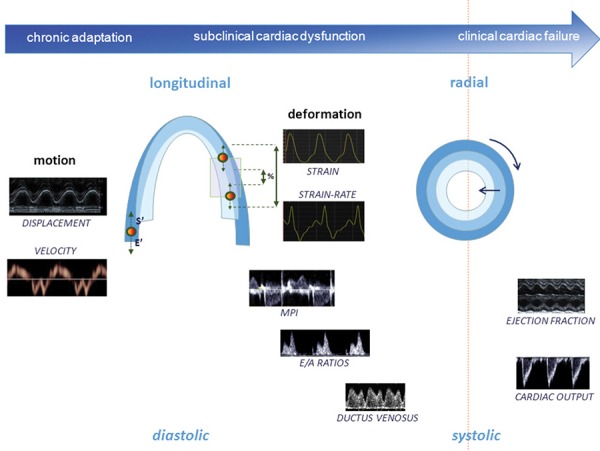
Figure 11.

Graphic representation of cardiac function parameters at the different stages of the fetal adaptation to disease, illustrating longitudinal and diastolic function becoming abnormal at earlier stages than radial and systolic. Ductus venosus, E/A ratios, myocardial performance index (MPI) and cardiac output are measured by conventional Doppler; ejection fraction and longitudinal displacement by M‐mode; systolic (s') and early diastolic (E') annular pea k velocities by spectral tissue Doppler; and strain and strain‐rate by offline tissue Doppler or 2D speckle tracking.
