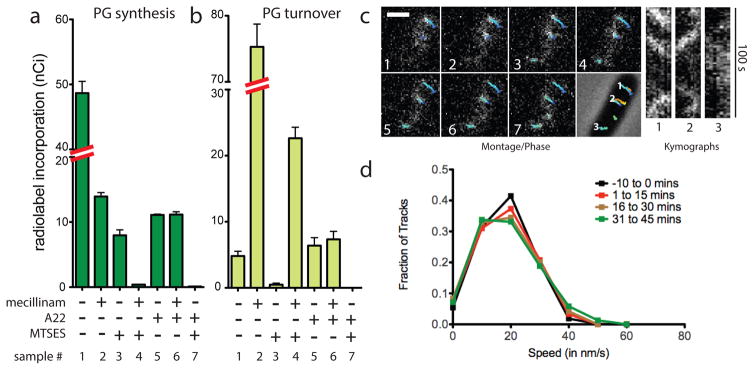
Fig. 2. PG polymerization by the Rod complex does not require aPBP activity.
A–B. Cells of HC533(attλC739) [ΔlysA ΔampD ΔponA ΔpbpC ΔmtgA MSponB (Ptac::sulA)] producing SulA to block cell division were pulse labeled with [3H]-mDAP following treatment with the indicated compound(s). Turnover products were extracted with hot water and quantified by HPLC and in-line radiodetection. PG incorporation was determined by digesting the pellets resulting from the hot water extraction with lysozyme and quantifying the amount of label released into the supernatant by scintillation counting. Compound concentrations used were: mecillinam (10 μg/ml), A22 (10 μg/ml), MTSES (1 mM). Results are the average of three independent experiments with the error bars representing the standard error of the mean (SEM). C. Left: Montage with overlaid tracks highlighting MreB movement in HC546(attλHC897) [ΔponA ΔpbpC ΔmtgA MSponB (Plac::mreB-SWmNeon)] after 30 min MTSES inactivation of PBP1b showing continuing MreB motion. Frames 2 s apart, scale bar = 1 μm. Original time-lapse movies are 1 sec/frame. Right top: Kymographs drawn along trajectories indicated on phase contrast image (1, 2, 3, left to right). Each tracked particle is highlighted with a colored trajectory with the color of the track (blue to red) indicating the passage of time. D. Distribution of velocities of MreB motion taken at different points after aPBP inhibition with MTSES (1 mM). For the tracks that we can accurately calculate a particle’s velocity, the fraction of moving particles only declines slightly (from 76% to 66%) during the time course following MTSES treatment. Microscopy results are representative of at least two independent experiments.

