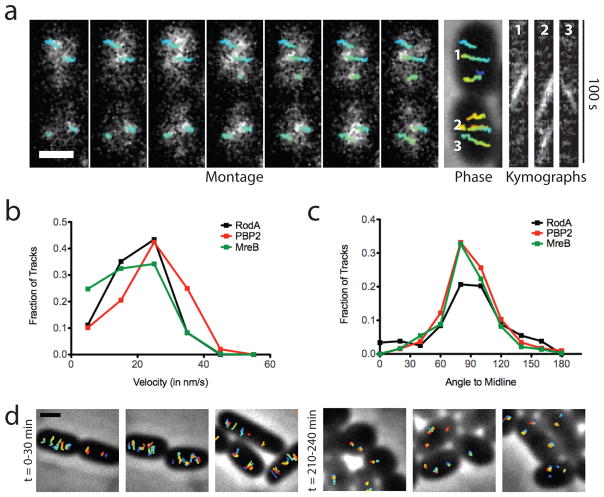
Fig. 3. PBP2 and RodA display directed, circumferential motions similar to MreB.
A. Left to right: Montage of PBP2 movement with overlaid tracks in HC596(attHKHC943) [ΔponA ΔpbpC ΔmtgA ΔpbpA (Plac::msfgfp-pbpA)]. Frames 2 s apart. Each tracked particle is highlighted with a colored trajectory as in Figure 2C. Trajectories 1, 2, and 3 in kymographs are in order left to right. B. Distribution of velocities of tracked particles of MreB (n = 807), PBP2 (n=1234) and RodA (n=243). C. Distribution of angles of PBP2 and RodA trajectories relative to the cell midline. D. Tracked particles of MreB-SWmNeon at 0–30 or 210–240 min after induction of RodA(D262N) from strain TB28(attHKHC929)/pHC938 [WT(PtetA::mreB-SWmNeon)/Plac::pbpA-rodA(D262N)]. Each tracked particle is highlighted with a different color trajectory overlaid on a phase contrast image. All scale bars are 1 μm. In all cases, original time-lapse movies are 1 sec/frame. Microscopy results are representative of at least two independent experiments.

