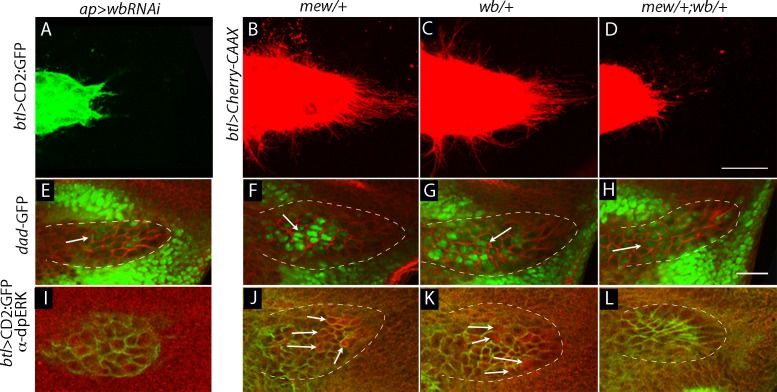
Figure 9. Genetic interaction between laminin mutants and integrin mutants.
(A,E,I) RNAi targeting expression of the laminin gene wb in the wing disc -altered ASP morphology and reduced ASP cytonemes (A) and reduced Dpp (dad-GFP fluorescence; E) and FGF signaling (α-dpERK staining; I). Genotypes: (A,I) ap-Gal4/+; btl-LHG lexO-CD2:GFP/UAS-wbRNAi; (E) ap-Gal4/+;dad-GFP/UAS-wbRNAi. (B–D, F–H, J–L) ASP morphology and number of ASP cytonemes (B,C), Dpp signaling (F,G) and FGF signaling (J,K) was normal in mew and wb heterozygotes but not in mew wb double heterozygotes (D,H,L). Arrows indicate signaling cells and dashed white lines indicate ASPs. Genotypes: (B) mewM6/+; btl-LHG lexO-Cherry-CAAX/+; (C) wb3/+; btl-LHG lexO-Cherry-CAAX/+; (D) mewM6/+; wb3/+; btl-LHG,lexO-Cherry-CAAX/+; (F) mewM6/+; dad-GFP/+; (G) wb3/+; dad-GFP/+; (H) mewM6/+; wb3/+; dad-GFP/+; (J) mewM6/+; (K) wb3/+; (L) mewM6/+; wb3/+. (J–L) Staining was with α-Dlg and α-dpERK antibodies. Scale bar: 25 µm.
DOI: http://dx.doi.org/10.7554/eLife.18979.026

