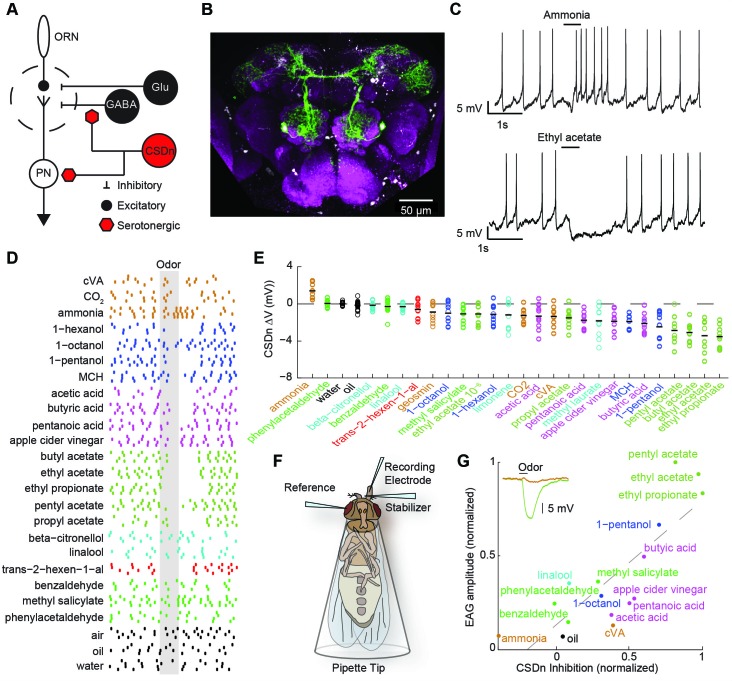
Figure 1. Olfactory stimulation hyperpolarizes serotonergic neurons innervating the AL.
(A) Schematic representation of the AL circuitry showing excitatory connections from ORNs to PNs, and lateral inhibition from both GABAergic and glutamatergic interneurons. Serotonergic input onto LNs and PNs is inferred from previous studies across other model systems (see text). (B) An anterior to posterior Z-projection of a Drosophila brain expressing GFP in the R60F02-Gal4 (CSD -Gal4) promoter line to illustrate the innervation of the CSDn (green) in the antennal lobe (white-dashed circles). Serotonergic neurons are labeled with a 5-HT antibody and co-localize with the soma of the CSDn (white arrows). Neuropil (magenta) is labeled with the nc82 antibody. (C) Whole-cell recordings from a CSDn showing excitatory and inhibitory responses to odors. Horizontal black line denotes period of odor presentation (500 ms). (D) A raster plot from one experiment showing that most odors inhibit the CSDn. Each tick represents one action potential from a CSDn. Odors are grouped and colored according to chemical class. Ammonia, CO2, and cVA, which activate very few ORNs types are grouped together. All odors are diluted 100-fold in paraffin oil except cVA and methyl laurate, which are undiluted. (E) CSDn responses are sorted by increasing strength of hyperpolarization. Each open circle represents one preparation. Horizontal black bar is the mean of 10 preparations. (F) Schematic representation of EAG recording paradigm. (G). Regression analysis shows correlation between EAG responses and hyperpolarization of the CSDn. Insert shows sample EAG responses to ammonia and pentyl acetate. R2 = 0.69, p=0.00007.

