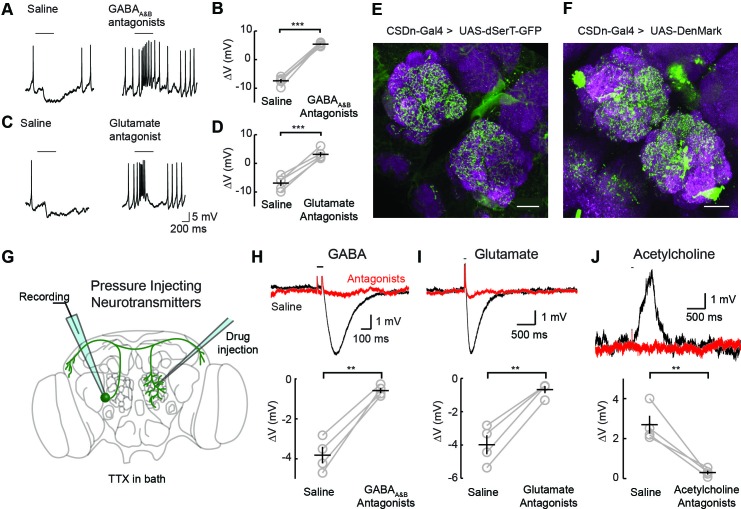
Figure 2. Inhibitory responses in the CSDn arise at the level of the AL.
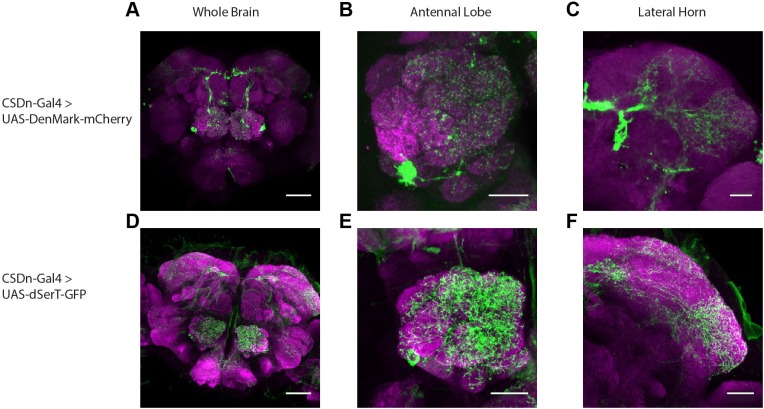
(A) Odor responses in the CSDn in normal saline and in the presence of the GABAA and GABAB receptor antagonists, picrotoxin (5 μM) and CGP54626 (50 μM) respectively. (B) GABA antagonists blocked the inhibition of the CSDn. n = 5, paired t-test, p=5.59 × 10⁻⁵. (C) The same protocol as in A except in the presence of 100 μM picrotoxin, which blocks inhibitory glutamatergic transmission in the fly. (D) Blocking inhibitory glutamate receptors also blocks the inhibtion of the CSDn. n = 5, paired t-test, p=5.12 × 10⁻⁴. (E) dSerT-eGFP is expressed selectively in the CSDn using the GAL4/UAS system. Presynaptic 5-HT release sites are seen as GFP signal in the AL. Neuropil is labeled as in Figure 1A. Scale bar = 20 µm in C and D. (F) The postsynaptic dendrite marker, DenMark, is expressed in the CSDn and visualized in green. (G) A cartoon representation of our protocol to reveal functional CSDn synapses within the AL. A sole CSDn neuron is drawn in green onto an schematic of the Drosophila brain. Cells are targeted using GFP and their neurites are stimulated with neurotransmitters delivered via pressure injection into the contralateral antennal lobe. To block polysynaptic and network contributions, TTX (1 μM) is added to the recording saline. (H) Top, sample hyperpolarizations of the CSDn in response to pressure injection of GABA in saline (black trace) and saline containing GABA antagonists (red trace). Antagonists as in A. The horizontal bar above the trace denotes the duration of pressure injection, and the coincident brief upward transient is an artifact from the opening and closing of the pressure injector’s valve. (H) bottom. A summary of recordings with GABA injection. Each gray circle represents one preparation. Black horizontal line is the mean across preparations and black vertical line shows the SEM. n = 4, paired t-test, p=0.002. (I) Same as in H, but for the application of glutamate and 100 μM picrotoxin. n = 4, paired t-test, p=0.002. (J) Same as in H, but for the application of acetylcholine and mecamylamine (100 μM). n = 4, paired t-test, p=0.008. *p<0.05, **p<0.01, ***p<0.001, N.S. = not significant. Same symbols used in all figures.


