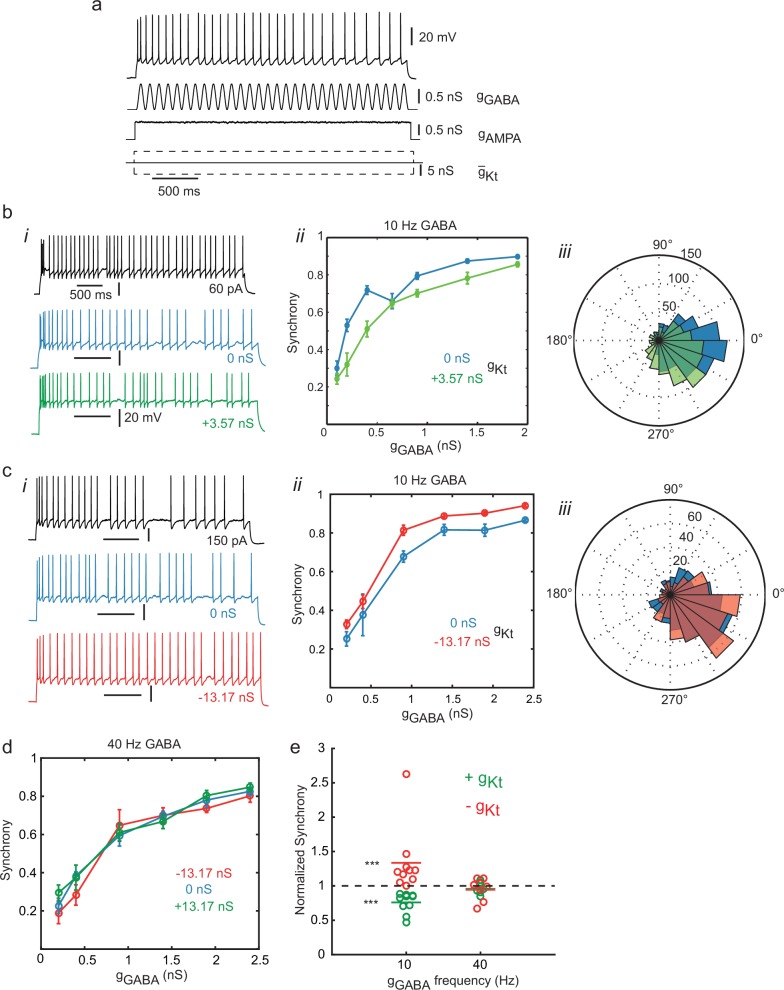
Figure 8. Synchronization to oscillating inhibition is controlled by gKt.
(a) Naturalistic stimulus protocol. The cell was stimulated with a constant step of AMPA conductance (gAMPA, reversing at 0 mV) with added conductance Ornstein-Uhlenbeck noise (standard deviation 2% of the step amplitude, τ = 5 ms), combined with a sinusoidal GABAA conductance (gGABA, reversing at −60 mV) and introduction of positive, zero or negative gKt. gAMPA was adjusted so that the cell fired close to the frequency of the gGABA inhibitory oscillation. (b) Effect of adding gKt on a slightly irregular-firing cell at 10 Hz gGABA. (i) Step current response (black), response to oscillatory conductance stimulus with (green) or without (blue) addition of 3.57 nS gKt. (ii) Spike entrainment synchrony (see Materials and methods, Spike Analysis) to the 10 Hz gGABA oscillation as a function of the oscillation amplitude. Synchrony rises progressively with oscillation amplitude in control (blue), and is depressed by the addition of 3.57 nS gKt (green). (iii) Spike phase histogram for pooled responses to lower amplitude gGABA oscillations (up to 1 nS), showing a reduction in the sharpness of synchrony. (c) Example of subtracting gKt in another irregular-firing cell at 10 Hz gGABA. (i) example responses. (ii) Subtraction of gKt (red) increased synchrony to gGABA oscillation over a wide range of amplitudes, when compared to control (blue). (iii) spike phase histograms for pooled responses up to 1 nS gGABA oscillations. Subtraction of gKt enhances the phase preference. (d) Lack of effect of gKt on synchronization to 40 Hz (gamma) oscillation. (e) Summary of effects of gKt perturbation on synchrony in different cells. Each symbol denotes an experiment on an individual cell, showing the ratio of synchrony, evaluated at ≈1/3 of the maximum gGABA amplitude applied in each case, during gKt injection, normalized to its control value with no injection. 10 Hz: gKt addition (n = 10, green) and subtraction, (n = 10, red); 40 Hz: gKt addition (n = 6, green) or subtraction (n = 7, red). At 10 Hz, but not 40 Hz, gKt perturbation has a significant effect. Wilcoxon nonparametric rank sum test, p=6.5 × 10⁻⁵ for both positive and negative gKt, and p=0.36 and 0.69 at 40 Hz for positive and negative gKt respectively.
DOI: http://dx.doi.org/10.7554/eLife.16475.023

