. 2016 Sep 20;5:e18227. doi: 10.7554/eLife.18227

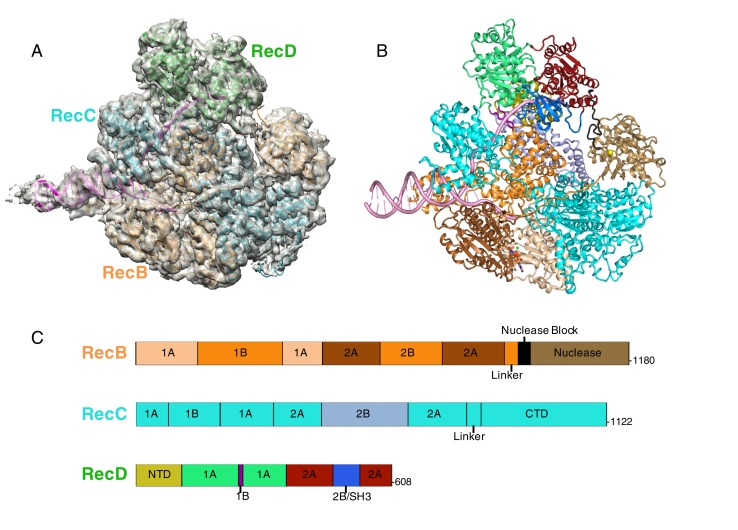
Figure 1. CryoEM structure of RecBCD/DNA complex at 3.8 Å resolution.

(A) Cartoon representation of the RecBCD complex within a transparent surface showing the electron density. The RecB subunit is in orange, RecC in cyan, RecD is in green, and the DNA is in pink, (B) ‘Road map’ for colour scheme used in subsequent figures using the colour scheme shown in (C), (C) Linear representation of the sequences, with labelling of relevant domains, of the three subunits showing the colour scheme used in subsequent figures. Further information about the quality of the CryoEM structure is presented in Figure 1—figure supplement 1. Examples of the quality of the electron density are shown in Figure 1—figure supplement 2.

DOI: http://dx.doi.org/10.7554/eLife.18227.003

Figure 1.

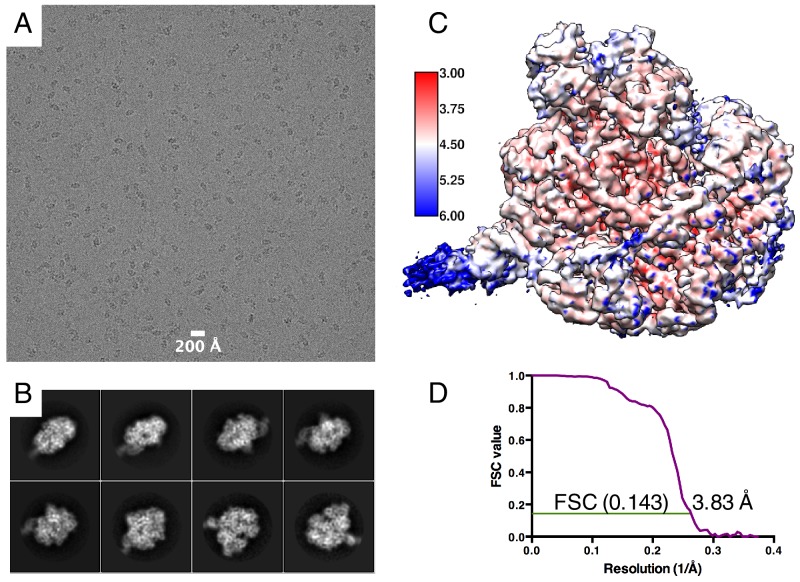
Figure 1—figure supplement 1. EM Data statistics.

Figure 1—figure supplement 1.

(A) An example of an aligned and summed image stack showing particle distribution. (B) Selection of 2D class averages representing different particle views. (C) Final map coloured by local resolution as estimated by ResMap (Kucukelbir et al., 2014). Scale bar shows colour scale with resolution in Å. (D) ‘Gold standard’ FSC curve showing estimated global resolution of 3.83 Å.
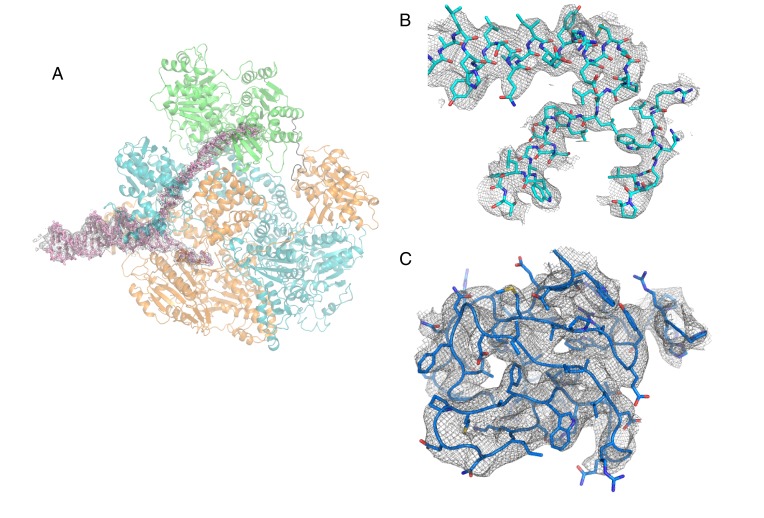
Figure 1—figure supplement 2. Representative sections of electron density (contorted at 4 σ).

Figure 1—figure supplement 2.

(A) Electron density corresponding to the bound DNA fork substrate, (B) Representative regions at the centre of the RecBCD complex to illustrate the quality of the maps, (C) The 2B/SH3 domain of the RecD subunit.