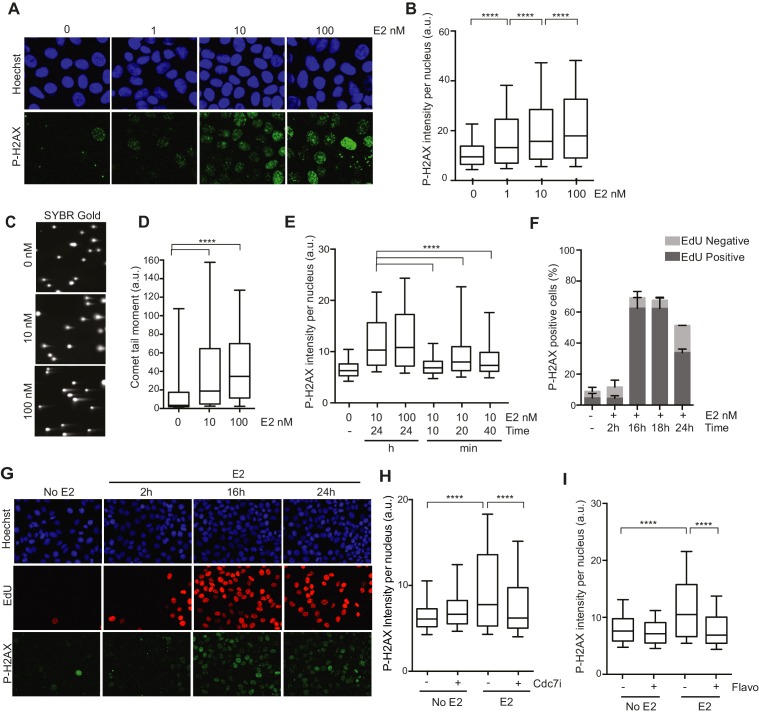
Figure 1. Estrogen induces DNA damage and DSBs in a replication-dependent manner.
(A) Immunostaining for P-H2AX in MCF7 cells treated with 0, 1, 10, or 100 nM E2 for 24 hr. (B) Quantification of P-H2AX immunostaining for data shown in (A), ****p<0.0001. n = 2 biological replicates. (C) Neutral comet assay in MCF7 cells treated with 0, 10, or 100 nM E2 for 24 hr. (D) Quantification of the neutral comet tail moment for data in (C). ****p<0.0001. n = 4 biological replicates. ≥50 comets/condition. (E) Quantification of P-H2AX immunostaining per nucleus in cells treated with 0, 10 or 100 nM E2 for indicated time prior to fixation. min = minutes, h = hours. ****p<0.0001. n = 3 biological replicates. (F) Quantification of the percent of P-H2AX positive cells and EdU staining in cells treated with 0 or 100 nM E2 for the indicated time. Cells were pulsed for 30 min with 10 μM EdU prior to fixation. Error bars represent SD of 2 biological replicates. (G) Immunostaining for EdU and P-H2AX for the experiment described in (F). (H) Quantification of P-H2AX immunostaining per nucleus in cells treated with 0 or 100 nM E2 concurrently with DMSO or 1 μM Cdc7 inhibitor PHA 767491 for 14 hr. Cells were pulsed with 10 μM EdU 30 min prior to fixation. n = 3 biological replicates. (I) Quantification of P-H2AX immunostaining in MCF7 cells treated with 0 or 100 nM E2 for 12 hr prior to the addition of 0.8 μM flavopiridol or DMSO for 2 hr. Cells were pulsed with 10 μM EdU for 30 min prior to harvesting. ****p<0.0001. n = 3 biological replicates. For all graphs: box and whiskers represent 25–75 and 10–90 percentiles, respectively. The line represents the median value. a.u. = arbitrary units. Associated p-values are from non-parametric Mann-Whitney rank sum t-test. >1000 cells/condition unless noted.
Figure 1—figure supplement 1. Immunostaining for 53BP1 in MCF7 cells either treated with 0 or 100 nM E2 for 24 hr.
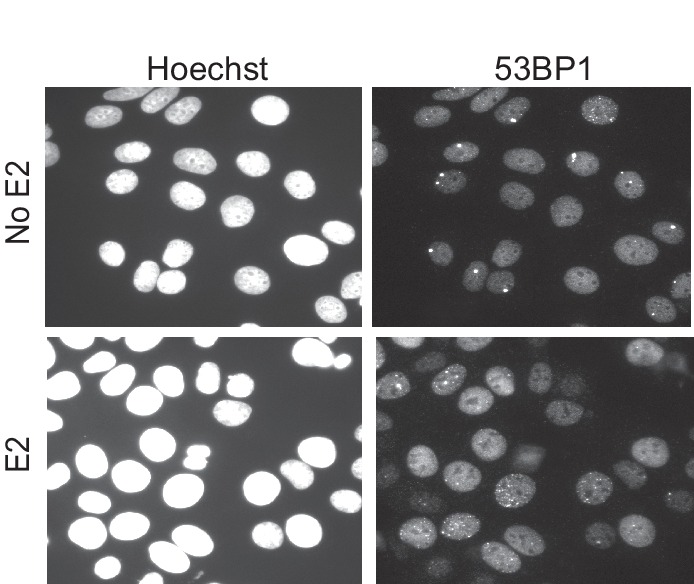
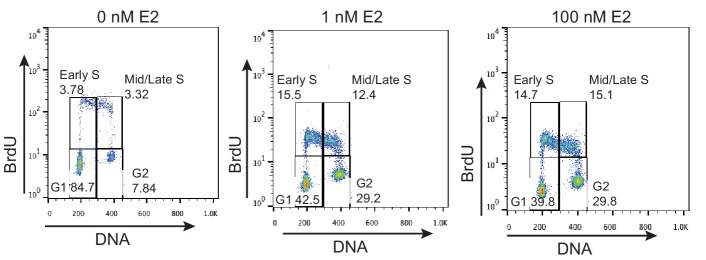
Figure 1—figure supplement 2. FACS profiles of MCF7 cells treated with 0 nM E2, 1 nM E2, or 100 nM E2 for 24 hr.
Figure 1—figure supplement 3. Effect of E2 on MCF10A cells.
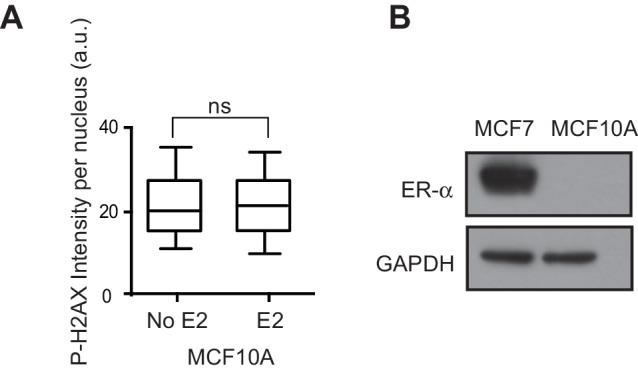
Figure 1—figure supplement 4. Quantification of the percent of cells positive for EdU incorporation after treatment with 0 or 100 nM E2 for the indicated length of time and then pulsed with 10 μM EdU for 30 min prior to fixation.
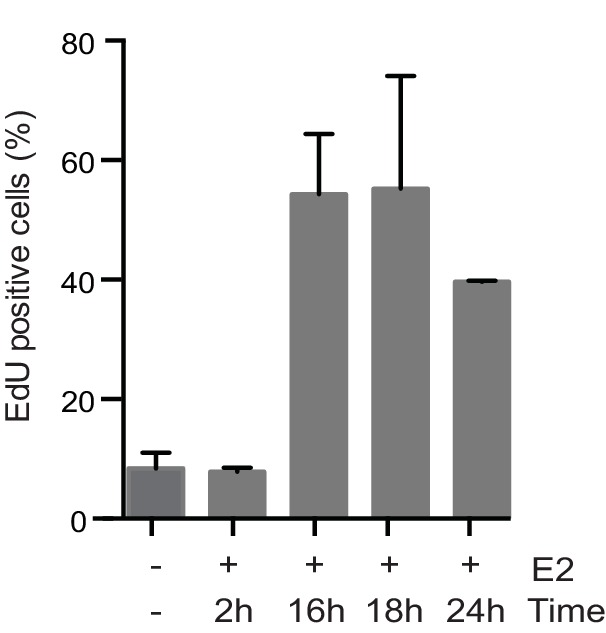
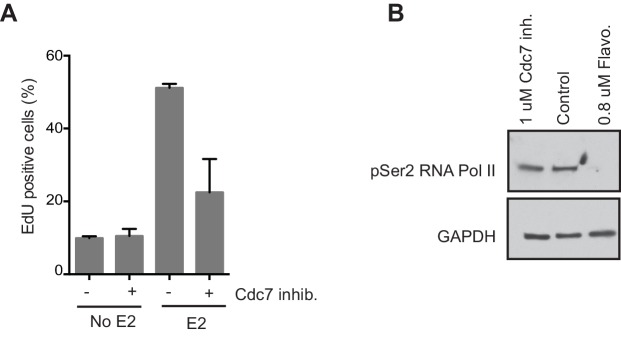
Figure 1—figure supplement 5. Effects of PHA 767491 on EdU incorporation and Ser2 phosphorylation of RNA Pol II in MCF7 cells.
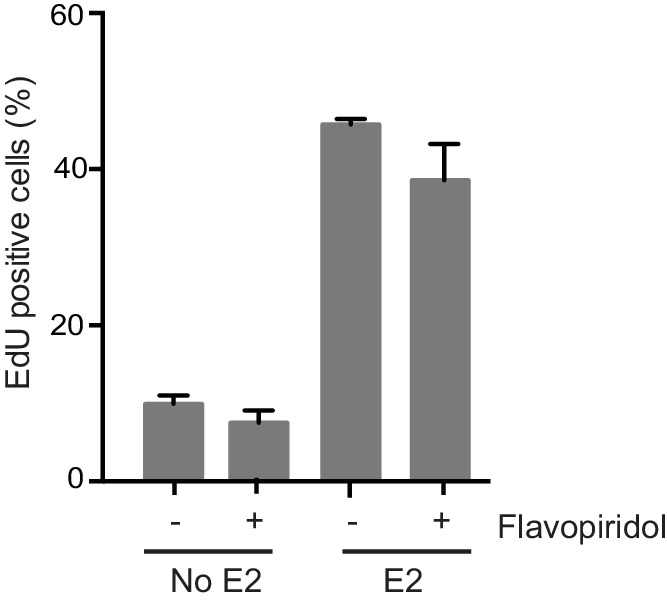
Figure 1—figure supplement 6. Quantification of the percent of cells positive for EdU incorporation for cells treated with 0 or 100 nM E2 for 12 hr prior to the addition of 0.8 μM flavopiridol or DMSO for 2 hr.
