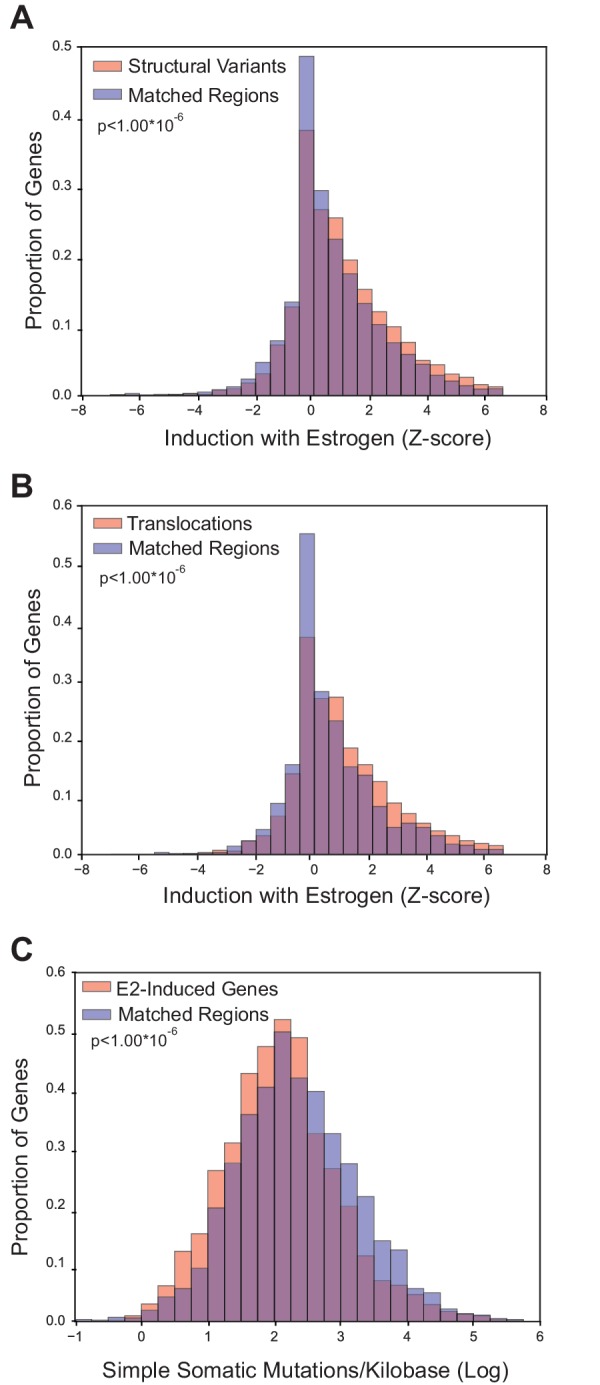
Figure 3. Breast cancer rearrangements are enriched in E2-responsive genes.
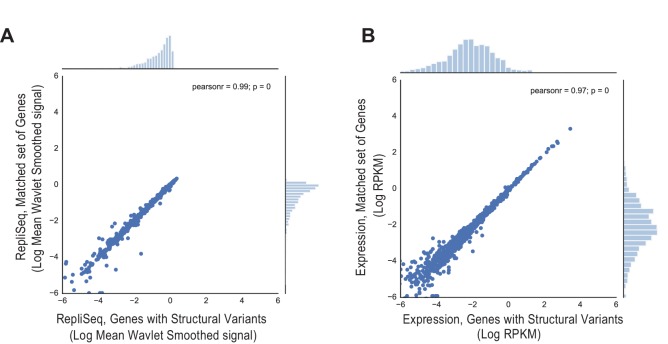
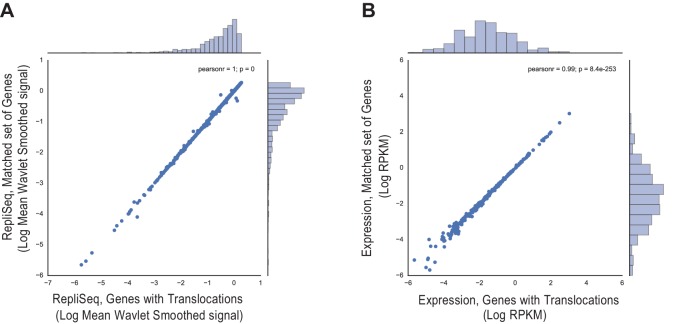
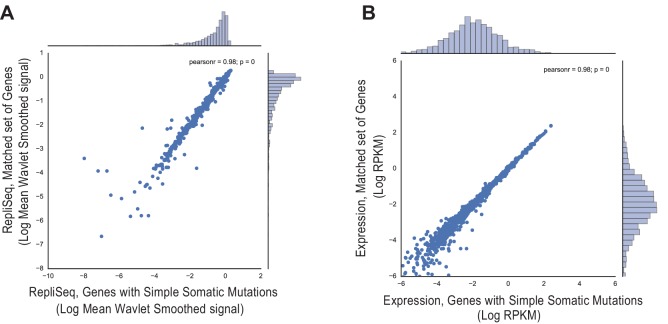
(A) Histogram of E2-induced expression changes (Z-score) for genes that overlap with breast cancer structural variants (red bars) compared to the distribution of E2-induced expression changes (Z-score) for a control gene set (blue bars), matched for expression level and replicating timing. Genes with structural variants are enriched in E2-responsive genes. p<1.00*10−6. (B) Histogram of E2-induced expression changes (Z-score) for genes with breast cancer translocations (red bars) compared to a control gene set (blue bars), as described in (A). Genes with translocations are enriched in E2-responsive genes p<1.00*10−6. (C) Histogram of enrichment of breast cancer simple somatic mutations in E2-responsive genes. Data plotted as the log transformation of simple somatic mutations per kilobase for E2-induced genes (red bars) relative to a matched set (blue bars), as described previously. E2-responsive genes have fewer simple somatic mutations than the control gene set (p<1.00*10–6). In A–C, p-values represent two-tailed bootstrap of medians. All breast cancer mutation data from (Nik-Zainal et al., 2016).


