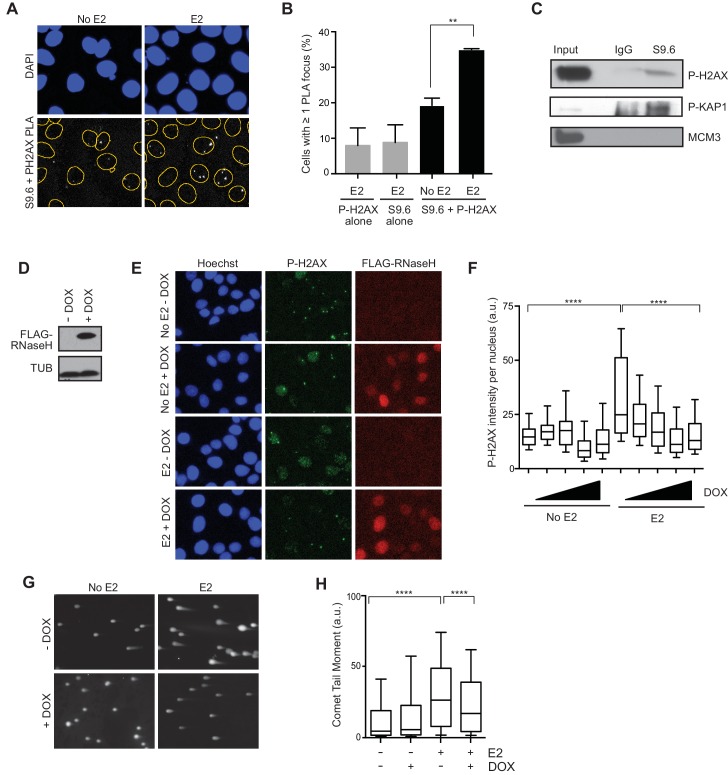
Figure 4. E2-induced R-loops occur on chromatin marked by DNA damage and RNase H reduces E2-induced DSBs.
(A) Proximity ligation assay between S9.6 antibody and P-H2AX antibody in cells treated either with 0 or 100 nM E2 for 24 hr. (B) Quantification of the percentage of cells with ≥ 1 PLA focus per nucleus. Single-antibody controls from cells treated with 100 nM E2 for 24 hr are shown. Error bars represent the SEM from 4 biological replicates. **p<0.01 (Student’s t-test). (C) P-H2AX and P-KAP1 levels from co-IP of S9.6 or IgG from cross-linked and sonicated cells treated with 100 nM E2 for 24 hr. Input is 60% of the IP. (D) Western blot with Flag antibody in MCF7 tetOn-RH cells. 1000 ng/mL doxycycline (DOX) was added for 48 hrs where indicated. (E) Immunostaining for P-H2AX and FLAG in MCF7 tetON-RH cells treated with increasing concentrations of DOX (100, 250, 500 1000 ng/mL) for 24 hrs prior to the addition of either 0 or 100 nM E2 for 24 hr. (F) Quantification of P-H2AX intensity for the experiment described in (E), where the triangle indicates increasing concentrations of DOX. ****p<0.0001 (non-parametric Mann-Whitney rank sum t-test). n = 3 biological replicates. >1000 cells/condition quantified. (G) Neutral comet assay in MCF7-tetOn-RH cells treated with or without 1000 ng/mL DOX for 24 hrs prior to 0 nM E2 or 100 nM for 24 hr. (H) Quantification of the neutral comet tail moment described in (G). **p<0.01 (non-parametric Mann-Whitney rank sum t-test). n = 3 biological replicates. >100 comets/condition. a.u. = arbitrary units.
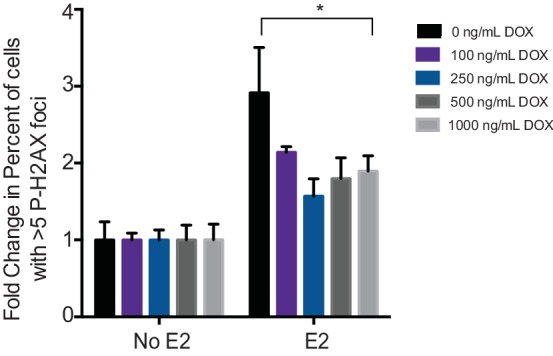
Figure 4—figure supplement 1. Quantification of the fold change in the percent of cells with >5 P-H2AX foci per cell in MCF7-tetON-RH cells treated with indicated concentrations of DOX. *p<0.05.


