
Figure 11. Mean PSD peak value in the 8–15 Hz range for the BG neuronal components before and after MPTP intoxication.
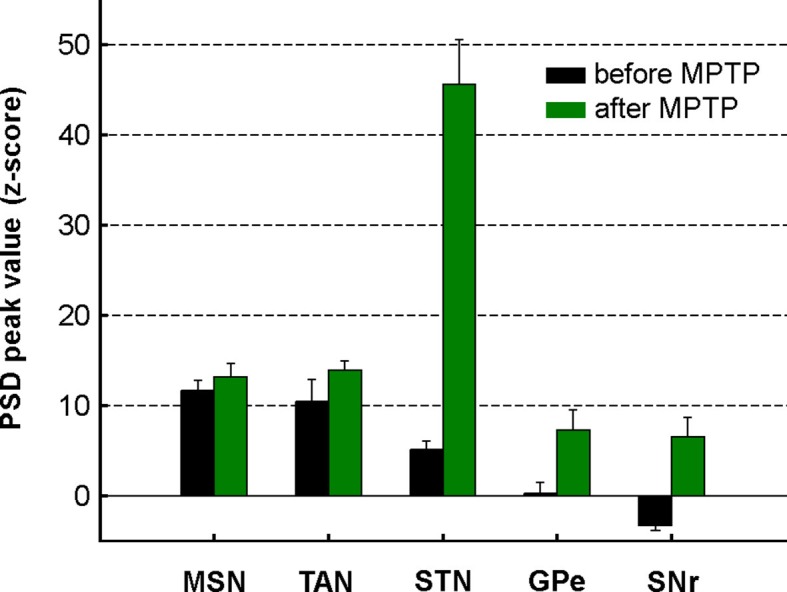
Mean PSD peak value in the 8–15 Hz range is defined as the average of the PSD peak values in the 8–15 Hz range (Z normalized) of all the PSDs. Error bars represent SEMs.