
Figure 13. Recording of the subthalamic spiking and LFP activity after MPTP intoxication.
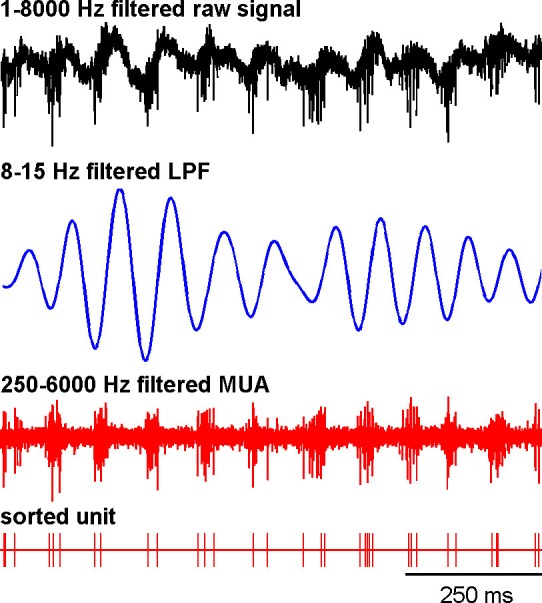
The traces reflect the different filter properties applied to the signal recorded by the electrode. Upper trace depicts the broad (1–8000 Hz) band-pass filtered trace. The second trace is band-pass filtered at the low beta range (8–15 Hz) and depicts LFP oscillations. In the third trace, a 250–6000 Hz band-pass filter is used and reveals the multi-unit activity (MUA) that exhibits a periodic oscillatory pattern synchronized to the 8–15 Hz LFP oscillation. Below the 250–6000 Hz filtered MUA is the digital display of the spikes detected online from the MUA using the online template-matching algorithm.