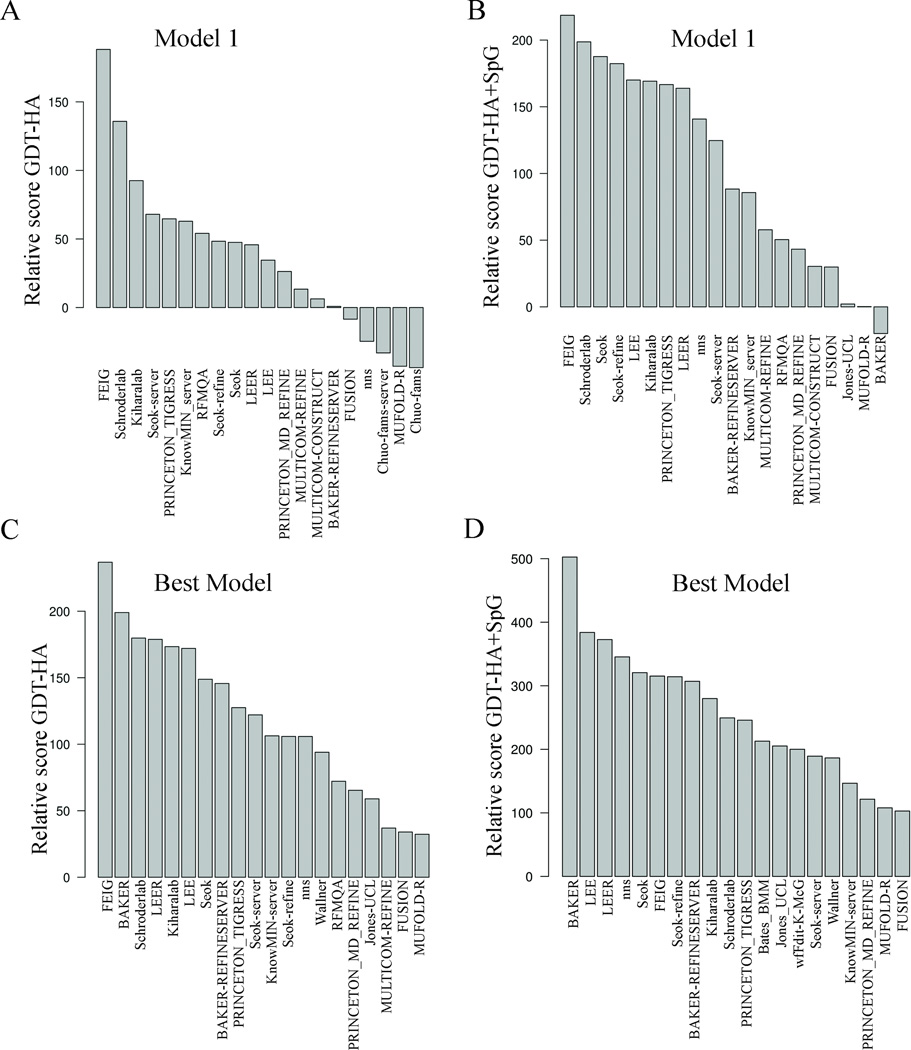
Figure 8.
Summary of relative scores of top 20 groups. The x-axis in all the plots displays the group names. The y-axis is the relative score for different metrics: A) GDT-HA for model 1; B) GDT-HA+SpG for model 1; C) GDT-HA for best model; D) GDT-HA+SpG for best model. The scores are calculated only for the groups who have predicted at least 35 out of 37 targets.

