Fig.2.
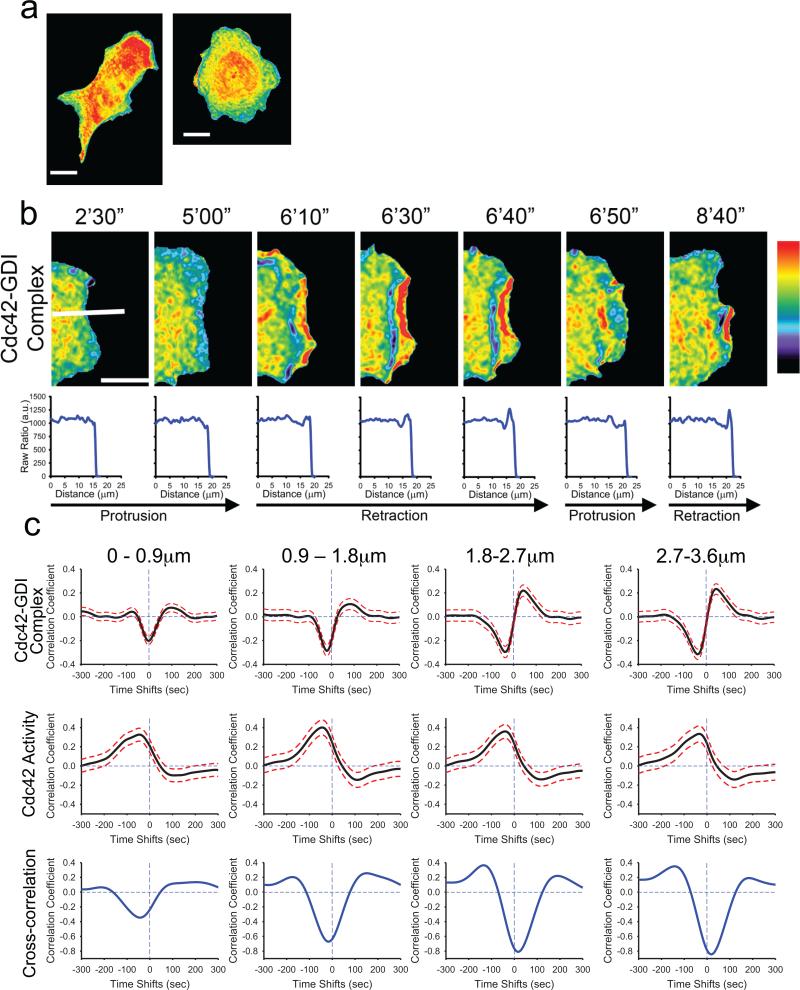
Cdc42-GDI complex localization in living cells. a, MEFs expressing the GDI.Cdc42 FLARE biosensor. Note the relatively uniform distribution of Cdc42-GDI complex except at the cell edges. b, Localization of GDI-Cdc42 at a cell edge undergoing protrusion/retraction cycles. Below each image is the fluorescence ratio measured along the white line shown in the first image GDI-Cdc42 complex is reduced at the cell edge during protrusion and increased during retraction. c, TOP: Correlation of Cdc42-GDI localization and edge velocity, measured using the GDI.Cdc42 FLARE biosensor. Correlation curves are computed from n = 704 individual windows in 8 cells (see Supplementary Fig. 6). MIDDLE: Correlation of Cdc42 activity and edge velocity measured in the wild-type MEFs using the MeroCBD biosensor. Correlation curves are computed from n = 420 individual windows in 7 cells. BOTTOM: Cross-correlation of the correlation curves shown in the top and middle rows. Panels (a) and (b) pseudocolor range: 1.0 = black; 1.4 = red. White bar indicates 10 μm.

