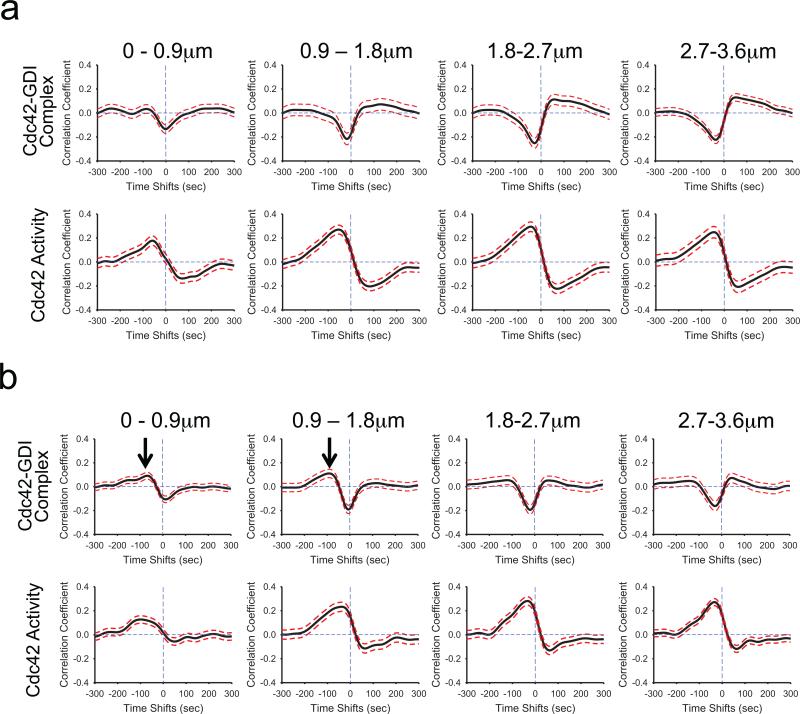
Fig.4.
Src-mediated phosphorylation of GDI at Y156 regulates the coordination of Cdc42-GDI localization and Cdc42 activity in regions close to the edge. a, A phosphorylation-deficient mutant of GDI (Y156F) had no effect on the timing of Cdc42 activation or modulation of GDI-Cdc42 localization. TOP: Correlation of Cdc42-GDI and edge velocity, using the T35S mutant of the GDI.Cdc42 FLARE biosensor expressed in cells containing Y156F GDI. Correlation curves are computed from n = 902 individual windows in 11 cells. BOTTOM: Correlation of Cdc42 activity and edge velocity using the MeroCBD biosensor in cells containing Y156F GDI. Correlation curves are computed from n = 373 individual windows from 5 cells. b, A phosphomimetic mutant of GDI (Y156E) produced positive correlation with edge velocity at negative time lags (i.e. after protrusion onset) similar to those of the correlation maxima of Cdc42 activity with edge velocity in regions close to the edge (0–1.8 μm; Black arrows). TOP: Cross-correlation of Cdc42-GDI and edge velocity using the T35S mutant of the GDI.Cdc42 FLARE biosensor expressed in cells containing the Y156E mutant GDI. Correlation curves are computed from n = 979 individual windows from 11 cells. Black arrows in regions 0–1.8 μm from the edge indicate the appearance of a positive cross correlation peak in GDI-Cdc42 complex localization. BOTTOM: Cross-correlation of Cdc42 activity and edge velocity, using the MeroCBD biosensor in cells containing GDI Y156E. Correlation curves are computed from n = 491 individual windows in 4 cells.

