
Figure 7.
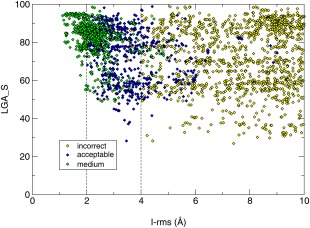
Subunit model accuracy and the quality of predicted complexes in CAPRI Round 30. The CASP LGA_S scores of subunit models in the predicted complexes for the 25 targets in this Round (vertical axis) are plotted as a function of the I‐rms values (horizontal axis). Each point in this Figure represents one submitted model, and points are colored according to the quality of the predicted complex, respectively, incorrect (yellow), acceptable (blue) and medium (green) quality (see Table 1 and the text for details).