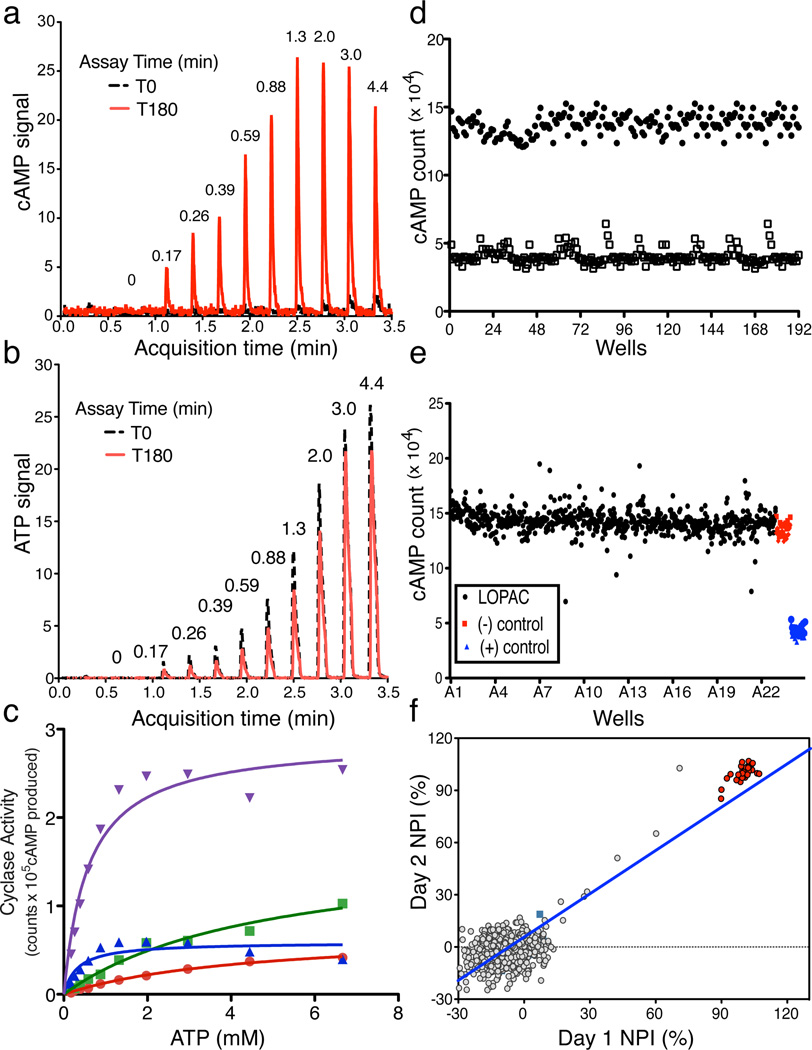
Fig. 1. Validation of RapidFire Mass Spectrometry System (RF-MSS) cyclase assay and high throughput screening conditions.
An example of a RF-MS chromatogram showing (a) the product cAMP as extracted ion intensity (EIC) × 103, and (b) substrate ATP as EIC × 104. Peaks derive from increasing input ATP (in mM) recorded at time “0” (black) and after 180 minutes incubation with sAC (red). (c) Human sAC activity measured using RF-MSS as a function of substrate of ATP-Mg2+ for 120 min in the presence of excess MgCl2 (20 mM). Shown are curves for Mg2+ alone (red dots), Mg2+/40 mM HCO3− (green squares), Mg2+/10 mM Ca2+ (blue triangles), and Mg2+/40 mM HCO3−/10 mM Ca2+ (purple triangles). Determinations are representative of at least two independent experiments and curves are nonlinear fits generated by Prism. (d–f) RF-MSS screen assaying sAC in the presence of 1 mM ATP/5 mM MgCl2/5 mM CaCl2/40 mM NaHCO3. (d) Comparison of active (black dots) and denatured (open squares) sAC enzyme: Z’ score = 0.7. (e) LOPAC library (1280 compounds) pilot screen (black); DMSO control (red); denatured sAC protein (blue). (f) Results of screening LOPAC library twice. LOPAC compounds (gray); DMSO control (green square); denatured sAC protein (red). (R2 = 0.81).

