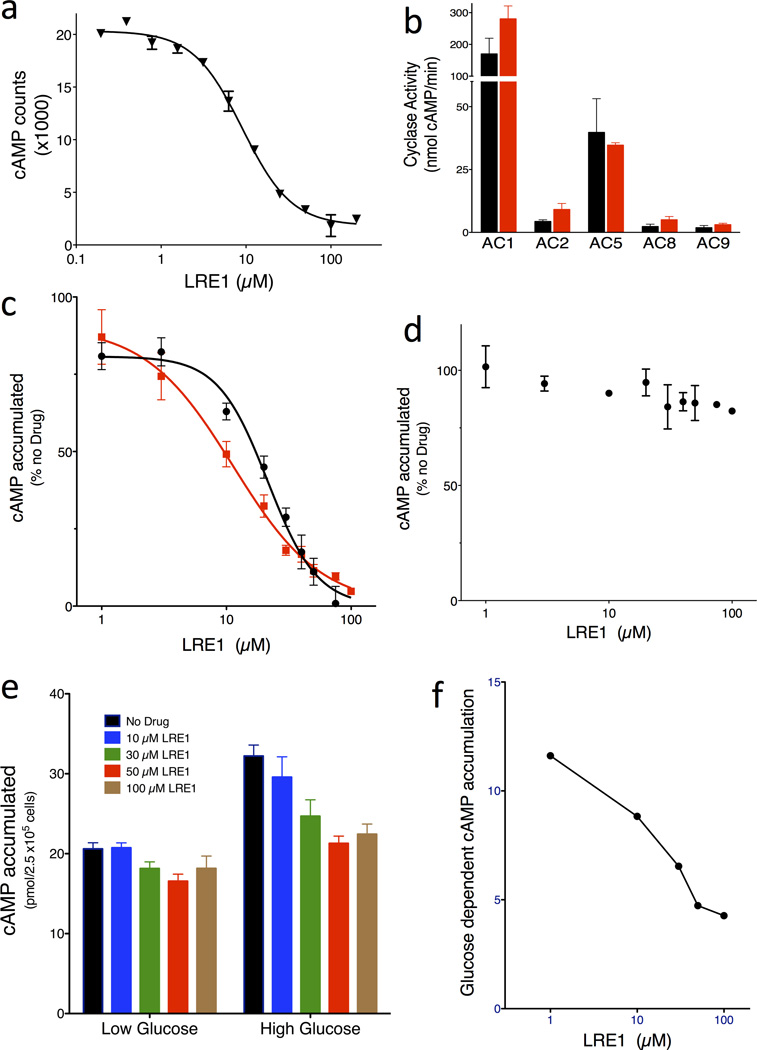
Fig. 2. LRE1 is a potent and selective inhibitor of sAC in vitro and in cells.
(a) Concentration-response curve of LRE1 on sAC protein in the presence of 1 mM ATP/5 mM MgCl2/5 mM CaCl2/40 mM NaHCO3. Values are averages of triplicate determinations with SEM. (b) AC activities of 293 cells overexpressing each of the indicated tmACs in the absence (black bars) or presence of 50 µM LRE1 (red bars). Shown are representative assays repeated at least three times; values represent averages of quintuple determinations of tmAC specific activity with SEM. (c) Concentration-response of LRE1 (red squares) and KH7 (black circles) on cellular accumulation of cAMP in sAC overexpressing 4-4 cells. (d) Concentration-response of LRE1 on cellular accumulation of cAMP in forskolin-stimulated sAC knockout fibroblasts. (c,d) Representative assays repeated at least three times; values are means ± SEM of triplicate determinations normalized to activity in the absence of any compound. (e) Concentration-response of LRE1 on glucose-induced cAMP production in INS-1E cells in 2.5 mM (low) or 16 mM (high) glucose with 0 (black), 10 (blue), 30 (cyan), 50 (red), or 100 (brown) µM LRE1. Shown are means ± SEM of triplicate determinations of at least three independent experiments. (f) The glucose-induced cAMP, calculated from panel (e) by subtracting the cAMP accumulated in low glucose from the cAMP accumulated in high glucose, in the presence of the indicated concentration of LRE1.

