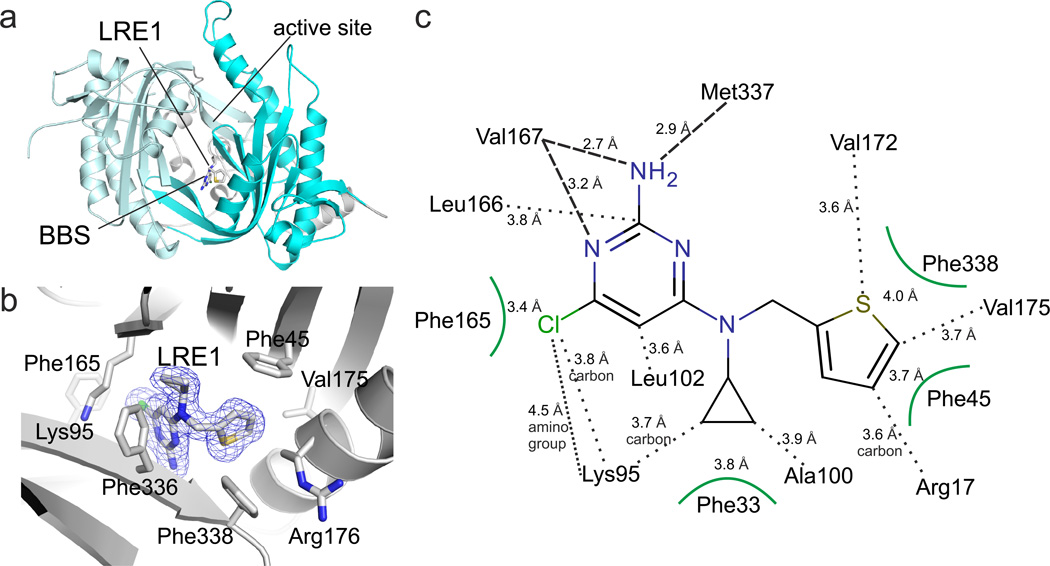
Fig. 3. Crystal structure of sAC/LRE1 complex.
(a) Overall structure of the sAC/LRE1 complex, with C1 in grey and C2 in cyan. LRE1 is shown in stick representation, and active site and BBS are indicated. (b) Close-up of the BBS with ligand and interacting residues as sticks colored according to atom type. LRE1 is overlaid with 2Fo-Fc electron density (blue) contoured at 1σ. (c) Interaction scheme for sAC and LRE1. Interactions of side chains are indicated by black dots and by arcs for aromatic residues, and backbone interactions by dashed lines.

