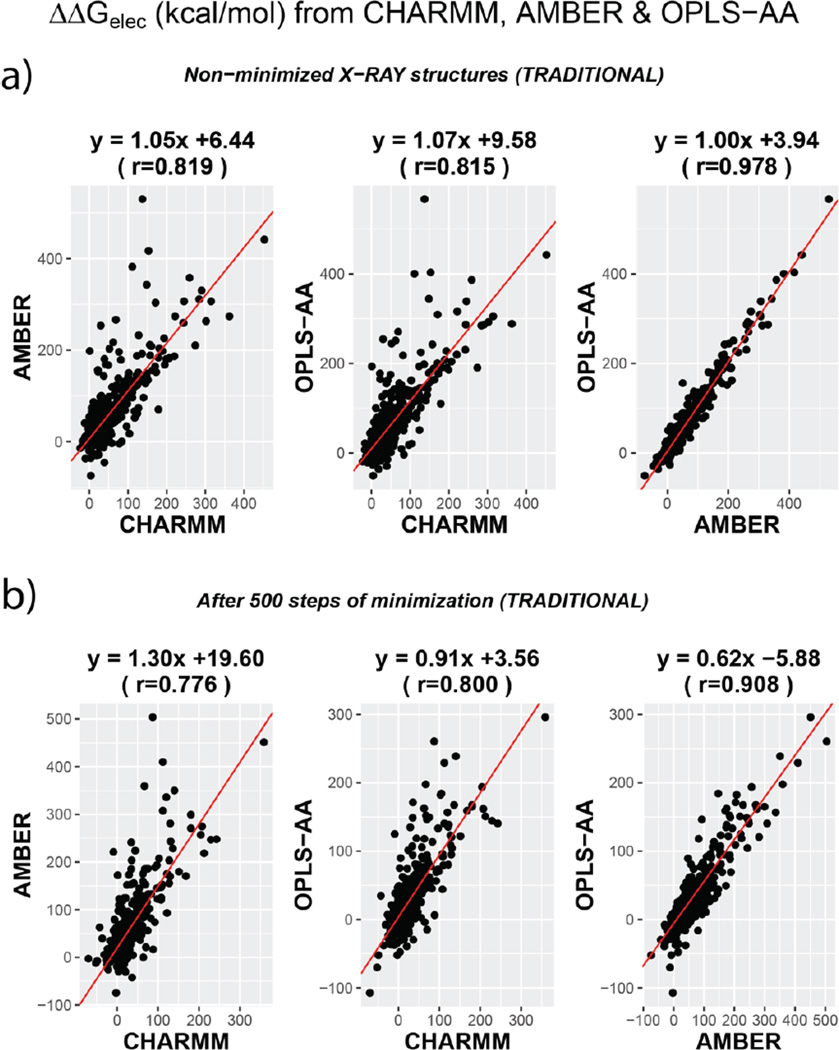
Figure 1.
Comparison of ΔΔGelec across the three force fields presented as scatter plots. TOP panel (a) compares values from non-minimized structures. BOTTOM Panel (b) compares them for structures obtained after 500 steps of CG minimization. The RED line indicates the straight line of best fit and the equations corresponding to each fit is mentioned on the top of the plots. All cases shown in Figure S1.

