
Fig. 6.
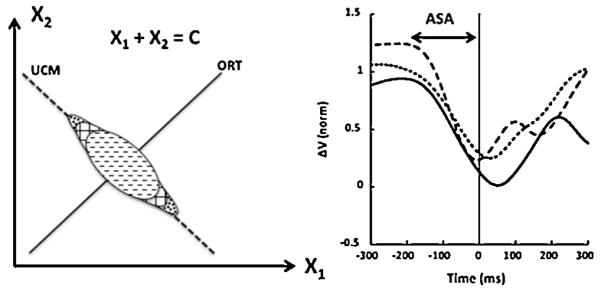
Left: An illustration of a task X1 + X2 = C. During steady state, data across trials form an ellipse elongated along the solution space (UCM). During preparation to a quick change in C, the amount of within-UCM variance starts to drop and/or the amount of the within-ORT variance starts to grow about 200–300 ms prior to the action initiation. Right: The time profiles of a multi-muscle synergy index (ΔV, normalized difference between within-UCM and within-ORT variances) during preparation to a quick action (at time zero) computed with three different methods (different curves). Note the anticipatory synergy adjustment (ASA). Reproduced by permission from Klous et al. (2011).