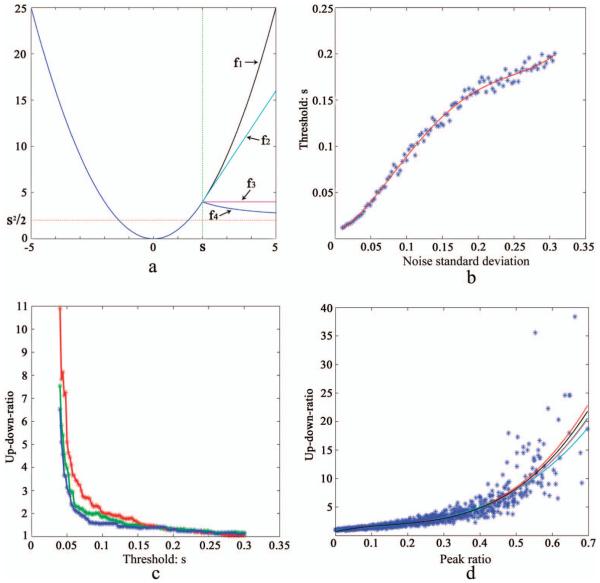
Fig. 1.
Cost functions and choice of threshold. (a) Images of different cost functions. The combination of blue and black lines f1 denotes the least squares penalty function, the combination of blue and cyan lines f2 denotes the asymmetric Huber function, the combination of blue and magenta lines f3 denotes the asymmetric truncated quadratic function, the combination of blue and blue lines f4 denotes the asymmetric Indec function, and the red dotted line denotes the asymptote of the asymmetric Indec function. (b) Relationship between the noise standard deviation σ and the optimal threshold s. Blue star points denote the optimal threshold s that corresponds to a noise standard deviation σ; the red line is a fitted fourth-order polynomial based on these blue star points. (c) Relationship between threshold s and the up_down_ratio. Red, green, and blue star points denote the up_down_ratio that corresponds to a threshold s. (d) Relationship between the peak ratio and the up_down_ratio. The five polynomial curves denote five simulations, and each curve is fitted using 1000 star points.

