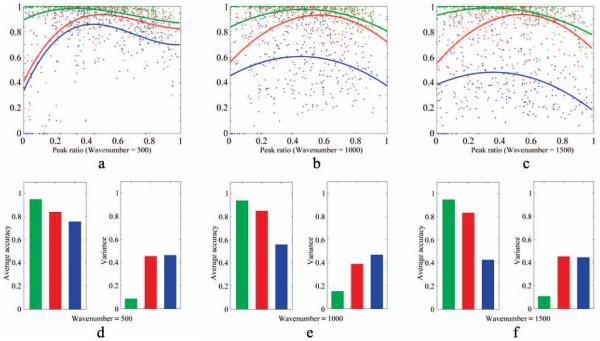
Fig. 5.
Comparison of Goldindec to two other methods using simulated data. Goldindec is in green, Paul’s method is in red, and Zhi-Min’s method is in blue. (a) Accuracy points and fitted curves with wavenumber 500. (b) Accuracy points and fitted curves with wavenumber 1000. (c) Accuracy points and fitted curves with wavenumber 1500. (d) Average accuracies and accuracy variations with wavenumber 500. (e) Average accuracies and accuracy variations with wavenumber 1000. (f) Average accuracies and accuracy variations with wavenumber 1500.

