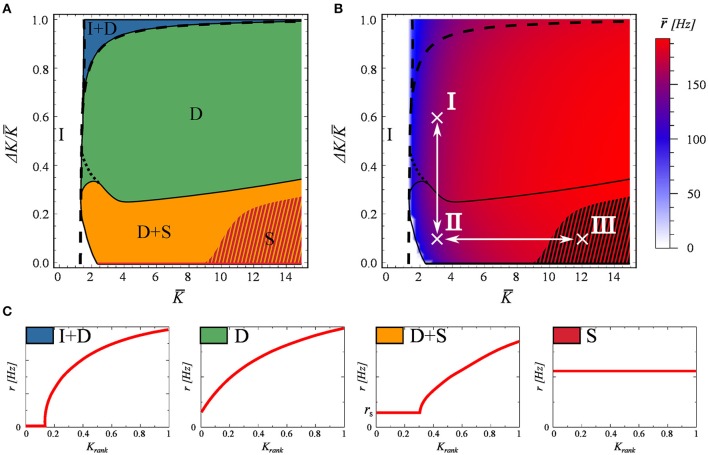
Figure 2.
The phase diagram, as obtained for a network of N = 100 neurons evolving according to Equations (2) and (3). The network matrix is flat, see Equation (5). Full and partially inactive (I), drifting (D), and synchronized states (S) are found as a function of the coupling parameters K and ΔK (Equation 7). (A) The dashed lines represent the phase transition lines as predicted by the stationary mean field approximation (Equation 13). The shaded region indicates the coexistence of attracting states S and S+D. (B) The average firing rate of the network. In black the phase boundaries and in white the two adiabatic paths used in Figure 3. (C) Examples of the four active dynamical states found. As in Figure 1.

