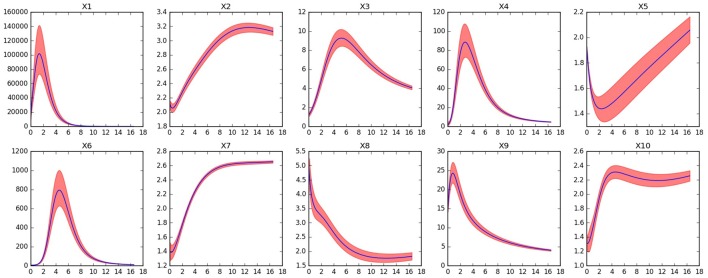
Figure 11.
Dynamics of the reduced system for the TCA cycle model after removing fast variables x1,x2,x4,x10, and x12. Red shaded areas show the deviation of repeated simulations using the full system for different initial values of the eliminated variables. Three standard deviations above and below are shown. See text for details.

