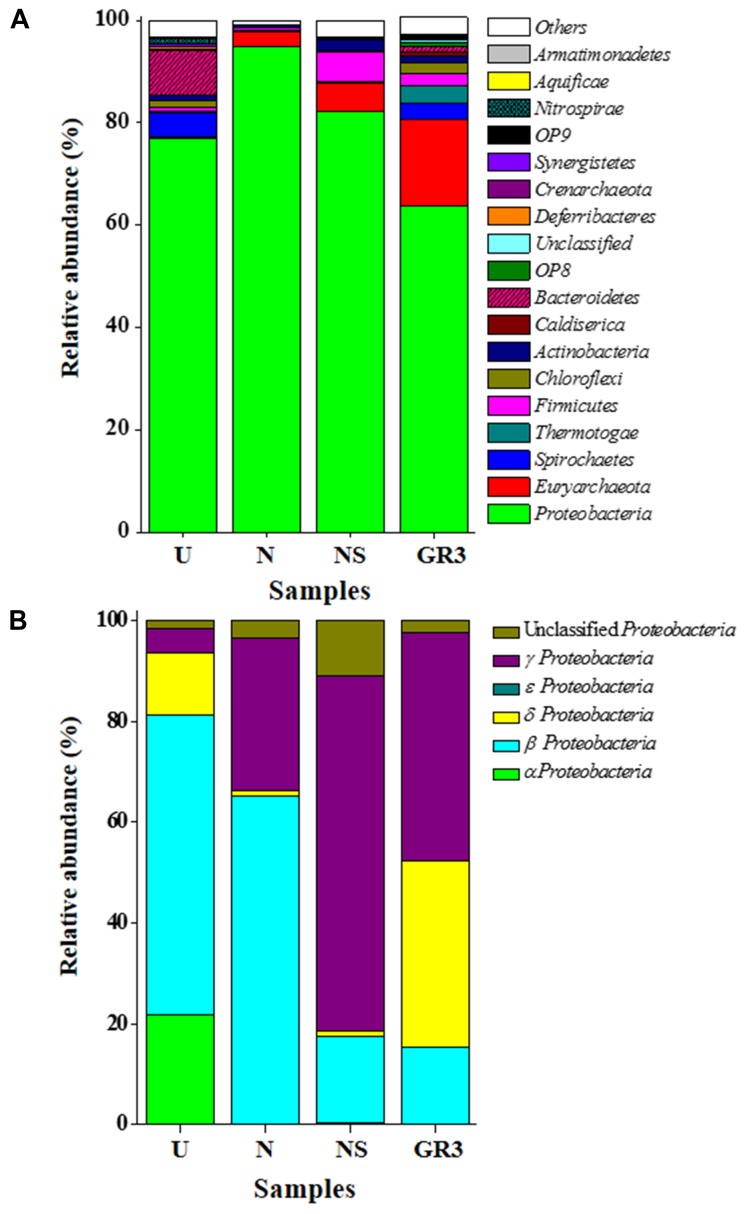
FIGURE 5.
Distribution of bacterial and archaeal groups in original and microcosm samples (at phylum-class level). Composition of microbial communities at phylum (A) and class (for Proteobacteria) (B) level. ‘Unclassified’ signifies sequences which did not match any known sequence in the database. OTUs with abundance <0.1% were added up and was represented as ‘Others.’

