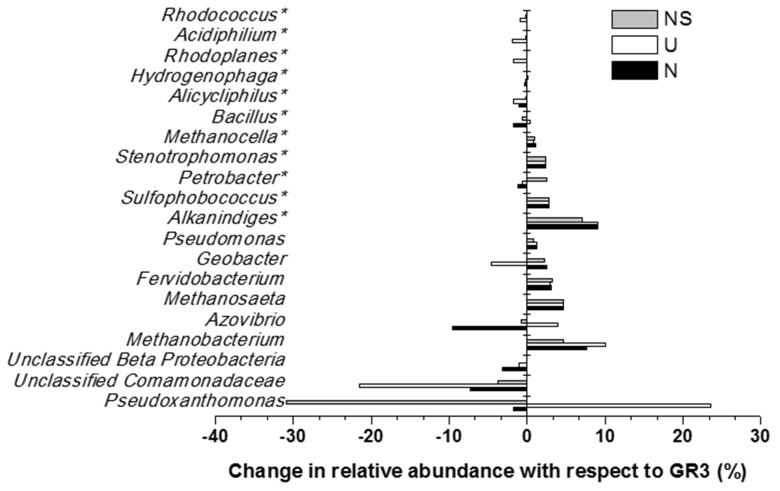
FIGURE 7.
Effect of amendments on microbial community composition (at genus level). Change in percentage abundance of genera in microcosm samples U, N and NS, as compared to original sludge, GR3. The abundance for genera marked with asterisk (∗) have been multiplied by a factor of 10 to indicate the change prominently. Negative values indicate increase and positive values indicate decrease in percentage abundance with respect to GR3.

